Progress Indicators in Infographics: How Visual Stage Tracking Transforms Storytelling
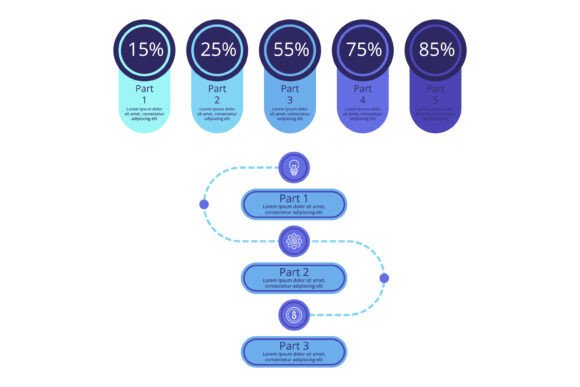
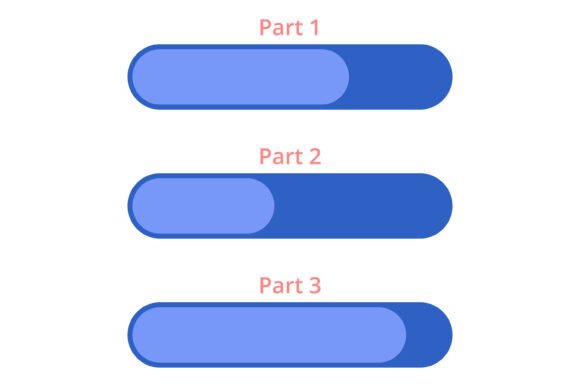
When you present information visually, every detail matters. The way you sequence data, the colors you choose, and the markers that guide the viewer from one section to the next all contribute to comprehension and retention. Progress indicators in infographics have emerged as one of the most effective tools for helping audiences follow complex narratives without getting lost. Whether you are mapping a customer journey, outlining a project timeline, or explaining a multi-step process, these visual cues provide structure and clarity. The thoughtfully designed infographic featuring three progression markers labeled Part 1, Part 2, and Part 3, rendered in a graduated palette of blue hues, exemplifies how intentional design can elevate an ordinary graphic into a compelling storytelling device.
This article explores why progress indicators matter, how they function across different contexts, and what you should consider when integrating them into your own visual communication strategy. We will examine real-world applications, practical benefits, and the subtle psychological effects that well-crafted progression markers have on viewers.
The Core Function of Progress Indicators in Visual Communication
At their simplest, progress indicators in infographics serve as waypoints. They tell the viewer where they are, where they have been, and what remains ahead. This may sound straightforward, but the cognitive load reduction it provides is substantial. When people encounter dense information, their brains instinctively look for structure. Without clear markers, the audience may bounce between sections, misinterpret relationships, or simply abandon the graphic altogether.
The three-part infographic described earlier uses Part 1, Part 2, and Part 3 as explicit signposts. Each segment builds on the previous one, creating a natural reading flow. The graduated blue hues reinforce this progression visually. A lighter blue might indicate the starting point, a medium tone the middle stage, and a deeper shade the final phase. This color gradation works on a subconscious level, signaling advancement and completion without requiring the viewer to read every label.
Beyond simple navigation, progress indicators also convey momentum. Seeing Part 1, then Part 2, and anticipating Part 3 creates a sense of forward movement. The viewer becomes invested in reaching the endpoint. This is particularly valuable in educational content, marketing materials, and onboarding sequences where keeping the audience engaged is paramount.
Why Graduated Color Palettes Enhance Comprehension
Color is not decorative in this context; it is functional. The blue palette used in the example infographic is a deliberate choice. Blue is associated with trust, stability, and calmness, making it ideal for professional and educational visuals. But the graduation from light to dark adds an additional layer of meaning. Research in visual perception shows that people naturally interpret darker shades as more advanced or significant. By aligning color intensity with progression stage, the designer creates an intuitive visual hierarchy.
Imagine a project roadmap where Phase 1 appears in a soft sky blue, Phase 2 in a mid-tone cerulean, and Phase 3 in a deep navy. Without reading a single word, the viewer understands that the journey moves from left to right, from light to dark, from beginning to end. This reduces friction and allows the audience to focus on the content itself rather than puzzling over the structure.
For designers and content creators, this means that progress indicators in infographics are not just about labels. They are about creating a cohesive visual language that guides the eye and reinforces the narrative arc. The three markers become anchors that break a potentially overwhelming amount of information into digestible segments.
Practical Applications Across Industries and Workflows
Progress indicators in infographics are not limited to one type of project or industry. Their versatility makes them useful in nearly every field where sequential information needs to be communicated clearly.
- Marketing and sales funnels: A three-part infographic can map the customer journey from awareness to consideration to decision. Each stage corresponds to a different type of content or touchpoint, and the progress indicators help stakeholders understand where prospects are in the pipeline.
- Project management: Visualizing a project lifecycle in three phases — planning, execution, and review — allows teams to track milestones at a glance. The graduated blue hues can reflect increasing levels of completion or urgency.
- Education and training: Course modules, skill levels, or learning paths benefit from clear progression markers. Students feel a sense of accomplishment as they move from Part 1 to Part 2, and the visual reminder of how far they have come encourages persistence.
- Health and wellness tracking: Whether it is a fitness program with three stages or a recovery plan, progress indicators make abstract goals feel tangible. Seeing the stages laid out visually motivates individuals to keep moving forward.
- Product onboarding: Software tutorials and user guides often use multi-part infographics to walk new users through setup, core features, and advanced settings. The progress markers reduce anxiety by showing exactly how much content remains.
In each of these scenarios, the specific design of the progress indicators matters. A generic bar or percentage may communicate completion but lacks the narrative richness of labeled parts with graduated color. The infographic with Part 1, Part 2, and Part 3 offers more than just data; it offers a story.
What to Consider When Choosing or Creating Progress Indicators
Not all progress indicators are created equal. Before adopting a particular style or format, it is worth evaluating a few key factors that can make or break the effectiveness of your visual.
Number of Stages and Cognitive Load
The example uses three parts, which is a powerful number. Three is easy to remember, visually balanced, and naturally fits many narrative structures: beginning, middle, end; past, present, future; problem, solution, result. However, your content may require more stages. If you need five or six phases, consider whether a single infographic remains the best format or whether a multi-page design would serve better. Progress indicators in infographics work best when the number of stages is small enough to be grasped at a glance. Going beyond seven stages often overwhelms the viewer and defeats the purpose of simplification.
Color Accessibility and Contrast
Graduated blue hues are visually pleasing, but you must ensure sufficient contrast between stages. A person with color vision deficiency may struggle to distinguish a light blue from a medium blue if the difference is too subtle. Adding text labels, as the example does with Part 1, Part 2, and Part 3, mitigates this risk. Additionally, consider using patterns, icons, or varying shapes alongside color to make the progression accessible to everyone.
Placement and Flow
Where you position the progress indicators within the infographic matters. Common placements include the top edge as a horizontal ribbon, the left side as a vertical timeline, or embedded within each section as a badge. The example infographic likely uses a clear, sequential layout that mirrors the reading direction of the target audience. For English-speaking viewers, left-to-right and top-to-bottom flow feels natural. For other languages, adjustments may be necessary.
Consistency Across a Series
If you create multiple infographics that each use progress indicators, maintaining visual consistency helps build recognition. Using the same blue palette, the same label format, and the same structural approach across your materials creates a cohesive brand language. Viewers who encountered your Part 1, Part 2, Part 3 infographic for one topic will immediately understand a similar graphic for a different topic, reducing learning time and increasing trust.
Scenarios That Demonstrate Real Value
Let us consider a few concrete examples where progress indicators in infographics made a measurable difference in communication effectiveness.
Scenario one: A nonprofit explaining a three-step advocacy campaign. The organization wants donors to understand how their contributions translate into action. The infographic shows Part 1: Community Outreach, Part 2: Policy Engagement, and Part 3: Legislative Change. Each section uses the graduated blue hues to show increasing impact. Donors can see exactly where their money goes and what stage the campaign is currently in. The progress indicators transform abstract donation cycles into a clear, motivating story.
Scenario two: A software company rolling out a new feature set. The product team creates an internal infographic showing the rollout in three parts: Beta Testing, User Feedback Integration, and Full Deployment. The progress indicators help cross-functional teams track where the project stands. During stand-up meetings, referencing "we are in Part 2 of the rollout" communicates instantly without lengthy explanations. The visual becomes a shared reference point.
Scenario three: A university designing a freshman orientation module. The infographic walks students through Part 1: Course Registration, Part 2: Campus Resources, and Part 3: Academic Planning. The graduated blue colors signal increasing familiarity with the university environment. New students report feeling less overwhelmed because they can see the entire journey laid out in three manageable steps. The progress indicators reduce anxiety and improve early engagement.
How Progress Indicators Influence Behavior and Perception
There is a psychological dimension to progress indicators in infographics that is worth acknowledging. The human brain craves closure. When we see a sequence with a clear endpoint, we are more likely to see it through. This is sometimes called the goal gradient effect — the tendency to increase effort as we get closer to a goal. A three-part infographic leverages this by giving the viewer a visible finish line. Part 3 feels like an achievement, and reaching it provides a sense of satisfaction that reflects positively on the content itself.
Additionally, the use of blue hues taps into feelings of professionalism and reliability. Unlike red, which can signal urgency or danger, or yellow, which can feel cautious, blue suggests steady progress. This is particularly important in corporate, educational, and healthcare settings where the audience needs to feel confident in the information being presented.
Another behavioral aspect is the serial position effect. People tend to remember the first and last items in a sequence best. With three parts, you have two prime memory slots — Part 1 and Part 3 — while Part 2 benefits from being the bridge. A well-designed infographic ensures that key messages are placed at these natural anchor points. The progress indicators help viewers mentally organize the content so that recall improves.
Practical Recommendations for Implementation
If you are considering creating or commissioning an infographic with progress indicators, here are actionable recommendations based on common considerations.
- Start with a clear narrative arc. Before choosing colors or labels, define what your three parts represent. Each part should have a distinct purpose and a logical relationship to the others. The infographic with Part 1, Part 2, and Part 3 works because each label implies a sequence that builds toward a whole.
- Choose a color palette that allows for meaningful gradation. Blue is a safe and effective choice, but you can also use teal, purple, or even gray tones as long as the progression is visually obvious. Test your palette with a small group to confirm that the stages are distinguishable.
- Label each part clearly and consistently. Use the same typography, placement, and phrasing for all three markers. The labels should be visible without competing with the main content. In the example, "Part 1, Part 2, Part 3" is simple and unambiguous.
- Consider adding a brief subtitle or icon for each part. While the labels alone convey progression, a short descriptor like "Discovery," "Development," "Delivery" can add context without cluttering the design.
- Test for readability and accessibility. Ensure that the progression is understandable even without color cues. Use contrast checkers and solicit feedback from diverse users before finalizing the design.
- Integrate the progress indicators into the overall layout organically. They should feel like a natural part of the infographic, not an afterthought. Alignment, spacing, and scale all contribute to whether the markers enhance or disrupt the visual flow.
Observing Trends and Future Directions
As visual communication continues to evolve, progress indicators in infographics are becoming more interactive. Digital infographics now include clickable stages that reveal additional information, hover effects that highlight the current part, and animations that animate the progression from one stage to the next. The static three-part infographic with graduated blue hues remains a timeless foundation, but modern implementations often layer interactivity on top.
Another emerging trend is the use of progress indicators in data storytelling. Rather than merely showing stages of a process, designers are using them to visualize the progression of metrics over time — for example, revenue growth in three quarters or skill acquisition across three training sessions. The same visual principles apply, but the content becomes more quantitative. The graduated blue hues can even correspond to data thresholds, adding a dual function of aesthetic cue and data encoding.
Finally, the growing emphasis on accessibility means that future progress indicators will need to be even more inclusive. Designers are exploring tactile markers, audio descriptions, and high-contrast alternatives for physical and digital infographics. The core idea — guiding the viewer through a sequence — remains the same, but the methods of delivery are expanding.
Progress indicators in infographics are not a passing trend. They are a fundamental tool for making complex information navigable, memorable, and engaging. Whether you are using a three-part structure with a blue palette or a more elaborate multi-stage design, the principles of clarity, consistency, and narrative flow will always apply. The next time you need to communicate a sequence of ideas, consider how a thoughtfully placed progression marker could transform your message from a collection of facts into a story worth following.