Human Chart Infographics Premiere Pro: A Modern Approach to Visualizing Demographic and Survey Data
Presenting data about people—demographics, survey responses, or group comparisons—often feels like a trade-off between accuracy and visual appeal. You want your audience to grasp percentages and categories at a glance, but standard bar charts and pie graphs can feel cold or impersonal. If you work with audience insights, market research, or educational statistics, you need a way to make numbers human again. Human Chart Infographics for Premiere Pro gives you exactly that: a template designed to turn cold data into relatable, visually striking stories that resonate with viewers.
Why Traditional Charts Fall Short for People-Focused Data
When you present demographic information—age groups, income brackets, or regional distributions—raw numbers alone rarely connect. A stacked bar might show that 40 percent of respondents are in one category, but it doesn’t help your audience feel the human weight behind that statistic. Similarly, survey data about opinions or behaviors can feel abstract when displayed in standard graphs. Viewers need to see not just the percentages, but the people behind them.
Another common challenge is making data accessible without oversimplifying. Business reports, marketing presentations, and educational videos often require showing multiple categories side by side. You may need to compare two groups, highlight a majority, or show change over time—all while keeping the design clean and professional. Traditional charting tools can do this, but they rarely let you customize icons, colors, or labels in a way that matches your brand or narrative tone.
How Human Chart Infographics Premiere Pro Bridges the Gap
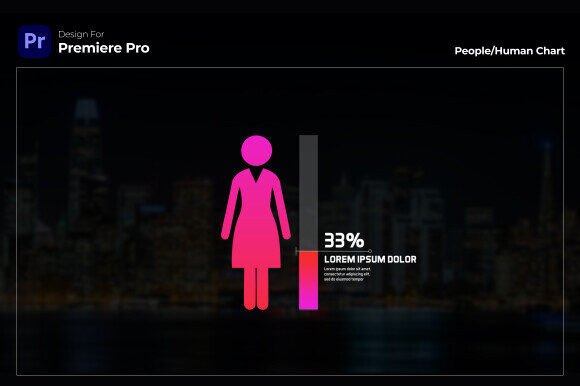
Human Chart Infographics Premiere Pro is more than a set of prebuilt graphics—it’s a framework for transforming demographic and survey data into a visual language that feels contemporary and approachable. The template uses diverse people icons as the core visual element, so each data point is represented by a human figure. This small shift has a big effect: instead of seeing a bar, your audience sees people. That visual cue makes percentages and comparisons feel tangible.
The template includes several chart types—grouped, stacked, and individual figure layouts—so you can match the format to your story. For instance, a grouped chart works well for comparing categories like age ranges or education levels. A stacked chart can show how a single group breaks down into subcategories, such as regional responses within a survey. Individual figure charts are ideal for highlighting specific data points or small sample sizes where each person counts.
You can customize the colors of the people icons to align with your brand palette or to differentiate categories. The value display is flexible too: add a percentage sign, currency symbol, or custom text before or after the numbers. This means you can use the same template for vastly different contexts—from showing market share percentages to illustrating budget allocation per demographic group.
Practical Solutions for Everyday Data Challenges
One of the biggest pain points for content creators is time. You might have the data ready but lack the design skills or hours needed to build custom graphics from scratch. Human Chart Infographics Premiere Pro solves this by providing a streamlined workflow. Because it works in Premiere Pro CC 2023 and above with no plugins required, you can drop it into your existing video project and start editing immediately. The font link is provided free, so there are no hidden costs or licensing hurdles.
For beginners, the template is intuitive. You don’t need to be a motion designer to adjust values, swap colors, or change chart types. The controls are laid out clearly, and you can preview changes in real time. Professionals will appreciate the flexibility to fine-tune every element—perfect for when a client requests last-minute changes to data or visual style.
Another common need is versatility. You might produce a quarterly business report one week and an educational explainer video the next. With the range of chart styles included, you can repurpose the same template for different audiences. Use stacked charts for annual reports to show year-over-year demographic shifts. Switch to grouped charts for marketing presentations that compare customer segments. The individual figure style works great for training videos or public health messaging where you want to emphasize individual experiences within a larger trend.
Real-World Applications and Outcomes
Imagine you’re preparing a marketing presentation for stakeholders. You need to show that 65 percent of your target audience is in the 25–34 age range, with 20 percent in 18–24 and 15 percent in 35–44. A stacked human chart instantly communicates the proportions in a way that feels inclusive and modern. The diverse icons help your audience see themselves in the data, which builds trust and relevance.
In an educational context, consider a video about survey results from students. You want to show that 72 percent prefer online learning, 18 percent prefer in-person, and 10 percent are undecided. Using human figures instead of bars makes the data more relatable for learners. It turns abstract statistics into a conversation about real people’s choices.
For nonprofit or public sector reports, human chart infographics can humanize data about community needs. Showing that 40 percent of residents lack access to broadband becomes more compelling when represented by people icons. The visual impact supports your call to action far better than a standard graph.
You can also layer the charts with other elements like callouts, annotations, or transitions to build a narrative. Because the template is fully customizable, you’re not locked into a single look. Adjust the icon colors to match your brand, add a subtle animation to draw attention to key data points, or combine multiple chart types in one sequence to tell a more complex story.
Tailoring the Template to Your Workflow
Different users will approach Human Chart Infographics Premiere Pro in ways that suit their unique needs. If you are a solo content creator or freelancer, you will likely appreciate the time-saving aspect. You can produce polished visuals in minutes without outsourcing design work. The intuitive controls mean you can focus on the narrative instead of technical adjustments.
For video production teams, the template fits naturally into a larger Premiere Pro pipeline. Because it uses standard features and no plugins, multiple editors can collaborate on the same project without compatibility headaches. The full HD resolution (1920×1080) ensures the graphics look crisp on screens large and small, from conference room displays to YouTube videos.
If you are an educator or trainer, you might use the chart templates to break down complex data into digestible visuals. The diverse icons help students connect with the material, especially when discussing social sciences, public health, or market research. You can quickly update the values for each semester or adapt the charts for different case studies.
Marketing professionals will find the template especially useful for creating consistent brand assets. The color customization lets you match corporate guidelines, while the flexible value display accommodates different metrics—percentages, dollar amounts, or unit counts. You can maintain a cohesive look across a series of videos or presentations, reinforcing brand recognition.
Recommendations for Getting the Most Out of the Template
Start by identifying the core story your data tells. Are you comparing groups, showing a distribution, or highlighting a single standout figure? Choose the chart type that aligns with that narrative. Grouped charts work best for side-by-side comparisons; stacked charts excel at showing parts of a whole; individual figures shine when each data point matters.
Customize the icon colors deliberately. Use your brand palette for consistency, or choose colors that psychologically align with your message—cool blues for trust, warm oranges for energy, greens for growth. Avoid using too many colors that could distract; three to five distinct hues are typically enough to differentiate categories without overwhelming the viewer.
When displaying values, think about what your audience needs to see first. If percentages are most important, make them prominent. If the raw numbers matter more for context, consider showing both. The template’s flexible value display lets you add symbols or text before or after the numbers, so you can tailor the label format to your specific use case—whether that’s “72%”, “$1.2M”, or “1,200 people”.
Finally, integrate the charts into a broader visual narrative. Use transitions to reveal data step by step, pair the infographics with voiceover or text callouts, and keep the overall design clean. The human icons do the heavy lifting of making data relatable, so you don’t need to overcrowd the screen with extra elements.
Moving Beyond Raw Numbers
Data visualization is ultimately about communication. When you present demographic or survey data, your goal is not just to inform but to help your audience understand and remember. Human Chart Infographics Premiere Pro helps you achieve that by putting people at the center of the story. The diverse icons, flexible layouts, and customizable display options let you adapt the same core tool to business reports, educational content, marketing campaigns, and annual summaries.
Whether you’re a beginner looking for a straightforward way to enhance your videos or a seasoned professional seeking efficient polish, this template offers a practical, modern solution. By replacing abstract bars with human figures, you make your data more approachable and your message more memorable. The result is a presentation that feels both professional and human—something standard charts rarely achieve. With the right template, your data doesn’t just get shown; it gets seen and understood.