Track Progress with Infographics
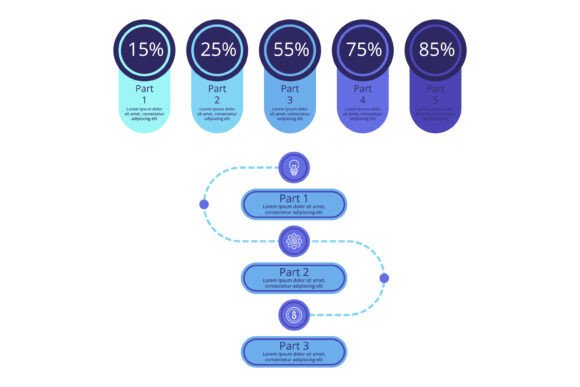
Numbers tell a story, but rarely do they captivate an audience on their own. That is where infographics step in, transforming raw percentages into a visual narrative that is both intuitive and inspiring. Whether you are mapping a journey from a tentative 15% to a confident 85% milestone or plotting incremental gains over time, tracking progress with infographics offers a crystal-clear progression map that keeps you and your viewers engaged every step of the way. It is not just about displaying data—it is about making progress tangible, memorable, and motivating.
What Makes Tracking Progress with Infographics So Effective?
At its core, tracking progress with infographics means using visual elements—charts, icons, color gradients, and milestone markers—to represent where you started, where you are now, and the path ahead. Each percentage point becomes a distinct visual cue, often paired with a unique illustration or color shift. For example, as you move from a humble 15% toward a triumphant 85%, the infographic might show a plant sprouting, growing leaves, and finally blooming. This layered storytelling helps people grasp progress not as a dry number but as a vivid journey.
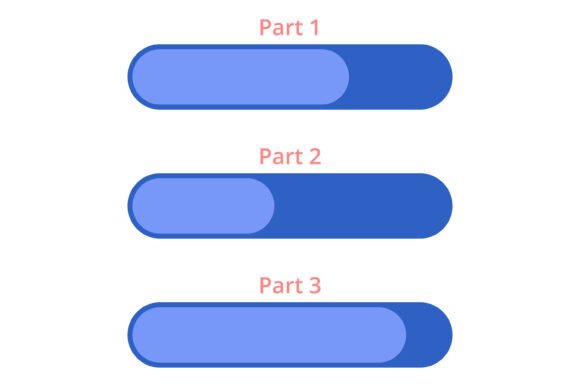
Why does this resonate? Because our brains process visuals far faster than text or numbers. When you see a progress bar fill up or a series of icons light up step by step, you intuitively understand the momentum. Moreover, well-designed infographics reinforce a sense of achievement at each milestone, which can sustain motivation for long-term projects or goals.
Who Benefits Most from This Approach?
Tracking progress with infographics is surprisingly versatile. Different groups derive unique value from it, depending on their needs and context. Let’s look at a few key audiences without pretending every group fits—this tool shines brightest for those who communicate progress to others or need to stay motivated themselves.
Beginners and Creators: Simplicity and Clarity
If you are new to a field—learning a language, building a fitness routine, or starting a side business—you often need a clear, gentle guide. Infographics that highlight milestones (25%, 50%, 75%, 100%) reduce anxiety by showing you exactly where you stand. For example, a beginner graphic designer might use a skill-progression infographic that moves from “basic shapes” (15%) to “mastering color theory” (85%). Each visual step feels like a small win, which encourages consistency. Creators, too, appreciate how easy it is to share such graphics on social media or in portfolios, conveying competence without overwhelming details.
Educators and Trainers: Engagement and Learning Value
Teachers and trainers often struggle to keep learners focused on long courses. A progress infographic that tracks module completion—from “Introduction” (15%) to “Advanced Application” (85%)—turns a curriculum into a visual adventure. One educator I know uses a mountain-climbing graphic: students see themselves ascending from base camp to summit, with each checkpoint unlocking new knowledge. This not only boosts motivation but also gives learners a sense of control over their own pace. The infographic becomes a shared reference point during discussions, making abstract progress concrete.
Entrepreneurs and Business Owners: Presentation and Reliability
For small business owners, investors, or team leaders, progress infographics serve a dual purpose: internal tracking and external communication. Imagine presenting quarterly revenue growth to stakeholders. Instead of a table, you show a sleek infographic where bars rise from 15% to 85%, annotated with key actions taken at each level. This approach instantly conveys reliability and strategic thinking. Similarly, project managers can use milestone infographics to show sprint completion in agile workflows. The visual format helps non-technical team members grasp complex timelines, while the clean design reflects professionalism—critical when building trust with clients.
Choosing the Right Tracking Tool for Your Needs
Not all progress infographics are created equal. When deciding whether to adopt this method, consider your priorities:
- Ease of use – If you are a hobbyist or freelancer, look for template-based tools (like Canva or Piktochart) that let you plug in numbers and customize icons. No design skills required.
- Flexibility – Professionals who need to update progress weekly will benefit from dynamic dashboards or infographic builders that link to live data. This avoids manual redrawing.
- Quality and cost – Premium tools offer high-resolution exports and bespoke illustration sets, but free tiers often suffice for personal or internal use. Weigh your budget against how often you’ll present the graphic to others.
- Speed and reliability – For real-time progress (e.g., fundraising campaigns), choose a tool that updates instantly and loads quickly on both mobile and desktop.
- Creativity vs. learning value – Some infographics prioritize artistic flair (animated elements, custom illustrations), while others emphasize clarity with simple bars and icons. Your audience dictates the balance: children may prefer playful graphics, executives may prefer minimal elegance.
Practical Applications Across Different Fields
To see how tracking progress with infographics works in real life, consider these scenarios:
- Fitness and wellness: A gym app uses a human body infographic that shades in muscle groups as you complete workouts. At 15%, only the arms are shaded; at 85%, the full body glows. Users feel a sense of physical transformation.
- Sales and marketing: A team tracks quarterly leads with a funnel infographic. Each percentage (15%, 30%, 45%, etc.) corresponds to stages like awareness, interest, and conversion. Managers quickly spot bottlenecks.
- Personal development: A reader tracking books read per year creates a library shelf infographic. Each book spine fills the shelf gradually—reaching 85% means just a few more reads before the year ends. This makes the goal feel achievable.
- Software development: A startup uses a roadmap infographic to show feature delivery. Milestones like “MVP” (20%), “Beta” (60%), and “Public Launch” (85%) align stakeholders and celebrate incremental wins.
How to Evaluate If Visual Progress Tracking Fits Your Goals
Before diving into infographic creation, ask yourself a few questions:
- What is the primary goal? Are you trying to motivate yourself, inform a team, or persuade investors? Each audience demands a different level of detail. Self-trackers often prefer simple visuals; decision-makers may require annotated milestones.
- How frequently will progress change? Static infographics work for step-by-step achievements (e.g., earning a certification). Dynamic living documents suit ongoing processes like revenue growth.
- What is your skill level? Beginners can start with pre-designed templates; experienced designers might build custom icons that align with brand identity. Don’t overcomplicate—clarity trumps complexity.
- Does the visual support your narrative? If your journey is nonlinear (e.g., sometimes regressing), choose a format that allows dips, like a progress wave instead of a straight bar. Honest progress tracking builds trust.
Ultimately, tracking progress with infographics is a match for anyone who values both data and storytelling. It helps you celebrate small wins, communicate complex trajectories, and remain accountable to your own goals. Whether you are an entrepreneur projecting next quarter’s targets, a teacher guiding students through a semester, or a hobbyist documenting a craft project, a well-crafted infographic turns abstract percentages into a journey you can see and feel. The key is to start simple, refine as you go, and remember that each milestone—no matter how small—deserves its own visual moment.