How to Make Great Infographics: A Practical Guide to Structured Visual Storytelling
Infographics have become a cornerstone of modern communication. They distill complex ideas into digestible visuals, making them indispensable for marketers, educators, entrepreneurs, and creators alike. But crafting an infographic that truly resonates is about more than just pairing charts with icons. It requires a deliberate process—one that prioritizes clarity, flow, and narrative momentum.
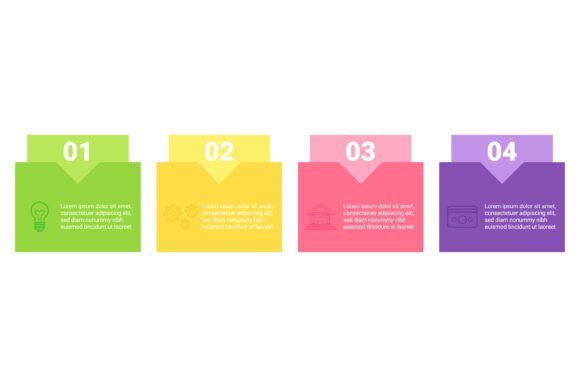
Imagine a vibrant infographic divided into four distinct, color-rich sections, each numbered to guide the viewer from start to finish. This is the anatomy of a great infographic. Each section not only adds visual appeal but also delivers precise information, creating a rhythm that transforms raw data into a memorable learning experience. The colors do more than decorate; they delineate phases, signal transitions, and sustain engagement. When executed well, the result is a tool that elevates comprehension and makes even the most methodical process feel intuitive.
Below, we break down the practical steps and strategic considerations behind building such an infographic—from planning and structure to execution and long-term use. Whether you are a seasoned designer or a business owner working with limited resources, this guide will help you create visuals that inform, persuade, and endure.
Why Structure and Color Matter in Infographic Design
A great infographic is not a random collection of facts. It is a carefully organized argument. The four-section layout with numbered areas serves a dual purpose: it establishes a logical sequence and provides visual breathing room. Each section becomes a self-contained unit of meaning, yet together they tell a complete story.
Color is your silent narrator. When you assign distinct hues to each phase, you create visual anchors. Readers instantly know that a new stage has begun, even before reading the headline. This reduces cognitive load and allows the audience to focus on content rather than navigation. The savvy use of color also adds an aura of intrigue—a well-chosen palette can evoke emotion, reinforce branding, or simply make the experience more enjoyable.
Where the Four-Section Infographic Fits in a Broader Workflow
This format is not limited to one context. It works across disciplines:
- Project management: Map the phases of a campaign, development cycle, or event timeline.
- Marketing: Illustrate a customer journey from awareness to advocacy.
- Education: Break down a scientific process, historical sequence, or skill-building progression.
- Personal productivity: Visualize a decision-making framework or goal-setting method.
Before you begin designing, ask yourself: where does this infographic fit in the larger process? Is it a planning tool used before a project starts? A reference guide used during execution? Or a recap used after a project wraps up? Knowing the use case will shape both the content and the level of detail.
Preparation: What to Do Before You Open Design Software
The most common mistake is jumping straight into layout and color selection. Preparation is where great infographics are born. Start by defining your core message. What single idea must the viewer take away? Every section should support that thesis.
Next, gather your data or information. Whether you are using survey results, step-by-step instructions, or conceptual frameworks, ensure every element is accurate and relevant. Irrelevant data points clutter the visual and dilute the message.
Now, map out your four sections. Give each a working title. What happens in section 1? What is the logical bridge to section 2? Ensure the sequence is intuitive. If you find yourself forcing an order, reconsider your structure. The numbered sections should feel inevitable, not arbitrary.
Tools and Resources for Planning
You do not need expensive software to plan. Use a simple document, a whiteboard, or a wireframing tool. Sketch rough rectangles for each section and jot down the key points that will live inside each one. Share this skeleton with a colleague or stakeholder early. Feedback at the planning stage is cheap; feedback after design is costly.
Consider compatibility with your existing assets. Will this infographic live on a blog post, a social media feed, a presentation slide, or a printed handout? The format influences dimensions, font sizes, and color contrast. Design with the final medium in mind.
Execution: Building the Four Dynamic Sections
With your plan in hand, it is time to build. Each of the four sections should follow a consistent internal structure while contributing to the overall rhythm. Here is how to approach each one:
Section 1: The Hook
This is where you establish context. Use a compelling headline, a key statistic, or a provocative question. The color for this section should be warm or attention-grabbing—think coral, deep orange, or a bright blue. Keep the text minimal. The goal is to draw the viewer in and make them want to continue.
Section 2: The Foundation
Now you build understanding. Introduce the core concepts or the first major stage of your process. Use a contrasting color that signals depth—perhaps a cooler tone like teal or forest green. This section may contain a short list, a simple diagram, or a comparative statement. Clarity is paramount.
Section 3: The Turning Point
This is often the longest section. It contains the bulk of the information or the most critical action step. The color here should be bold but not overwhelming—a rich purple or a deep red can signal importance. If your infographic describes a process, this is the implementation phase. Use icons or small visual cues to break up text.
Section 4: The Resolution
Close with impact. Summarize the outcome, provide a takeaway, or call the viewer to action. The final section’s color should feel conclusive—perhaps a neutral gray with an accent, or a dark shade that anchors the entire piece. This is where you reinforce the main message and leave a lasting impression.
Balancing Visual and Verbal Content
Each section must balance text and visual elements. Avoid walls of text. Use short sentences, bullet points (in the final design, not here), and bold keywords to guide the eye. Icons, charts, and illustrations should complement the words, not repeat them. The numbered structure itself acts as a visual organizing principle—lean into it.
Practical Implementation Tips for Real Workflows
Now that you understand the architecture, let’s talk about fitting this into an actual workflow.
- Start with a template. Do not reinvent the wheel. Use a four-section template in your design tool of choice. Customize the colors and content. This saves hours.
- Test readability early. Zoom out to 50% view. Can you still read the headlines? Are the numbered sections distinguishable? If not, increase contrast or font size.
- Iterate on color before content. Spend a few minutes exploring different palettes. Tools like Adobe Color or Coolors can help. Once the colors are locked, the design feels cohesive.
- Use real data where possible. Generic statistics weaken credibility. If you are making an infographic for a client or your own business, use actual numbers or quotes. This builds trust and aligns with E-E-A-T principles.
- Involve a reviewer. Before publishing, have someone unfamiliar with the topic walk through the four sections. Ask them to explain what they learned from each one. If they miss a point, revise.
Usability and Consistency Across Platforms
If you plan to share the infographic across multiple channels, check how it renders on each one. On Instagram, a vertical crop may cut off sections. On a blog, the full width may be reduced. Create a master version and then adapt it. Keep the same four-section structure but adjust proportions. Consistency in design language—colors, fonts, icon style—helps your audience recognize your work instantly.
Quality Control and Long-Term Use
An infographic is not a one-and-done asset. It can be reused, updated, and repurposed. After publication, track engagement metrics. Which section did viewers linger on? Which one had the highest click-through? Use that data to refine future designs.
For long-term use, maintain a master file with editable layers. When data changes, you can update one section without rebuilding the entire graphic. This is especially useful for recurring reports, annual summaries, or evolving processes.
Archiving and Organization
Name your files consistently. Include the topic, date, and version. Store them in a shared folder if you work with a team. This makes it easy to retrieve and repurpose infographics months or years later. A well-organized library of infographics becomes a valuable resource for pitches, proposals, and training materials.
How This Approach Elevates Learning and Retention
The four-section, color-coded structure is not just aesthetically pleasing—it is pedagogically sound. When information is chunked into meaningful groups, retention improves. The numbered sequence provides a clear path, reducing confusion. The colors act as memory cues: viewers recall the blue section or the orange section, not just the text.
For educators and trainers, this format is especially powerful. You can use the infographic as a handout before a workshop, as a visual aid during the session, and as a reference afterward. The rhythm of progression helps learners scaffold new knowledge onto existing understanding.
When to Evolve Beyond Four Sections
Not every topic fits neatly into four parts. If you find yourself cramming too much into one section, you may need five or six. The principle remains the same: group related ideas, number them, and use color to distinguish phases. The four-section model is a starting point, not a prison. Adapt it to your content, but preserve the clarity and rhythm.
Final Observations on Building Great Infographics
The best infographics feel effortless. They guide the reader from one idea to the next without friction. Achieving that ease requires deliberate effort on the back end—planning, structuring, testing, and refining. The four-section infographic with distinct colors and numbering is a proven method because it respects the viewer’s time and cognitive limits.
Whether you are outlining a marketing funnel, explaining a scientific concept, or mapping a creative workflow, this approach works. It balances visual appeal with informational density. It turns a passive viewing experience into an active learning journey. And when done well, it becomes a tool people want to share, bookmark, and revisit.
Start with a clear message. Build your four sections with purpose. Choose colors that guide and delight. Then let the infographic do what it was designed to do: illuminate the process, one numbered section at a time.