Infographics Flat Round Icons: The Visual Language of Modern Communication
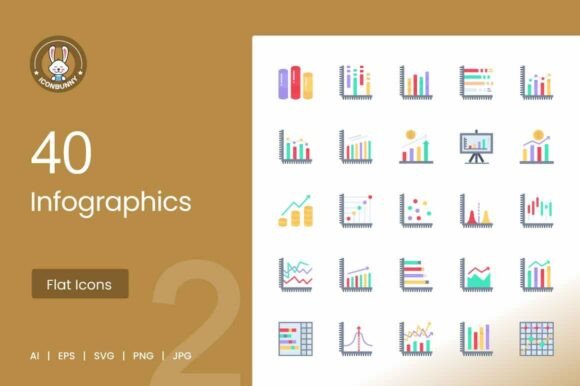
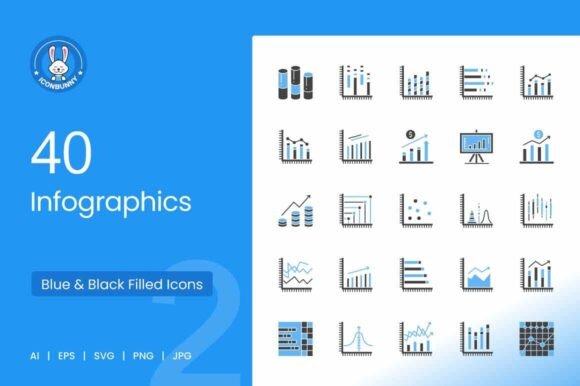
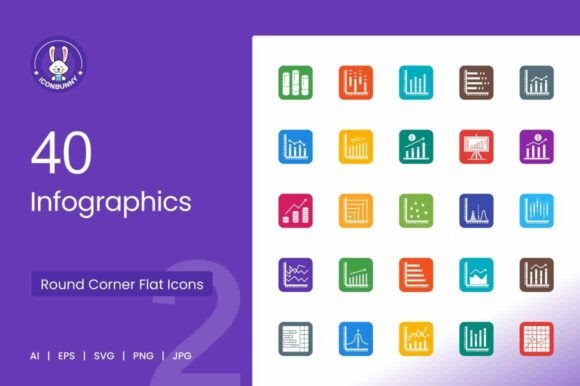
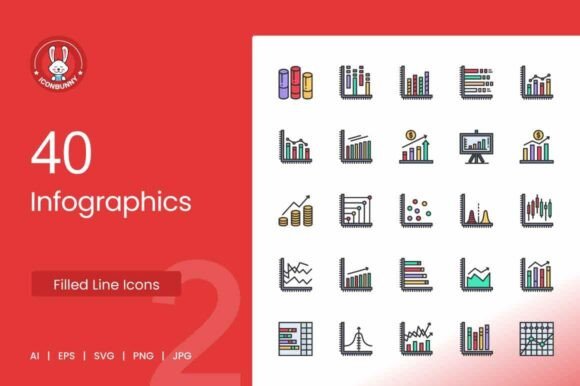
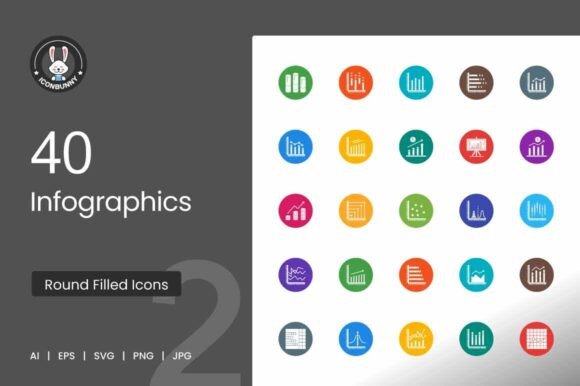
In an era where data drives decisions and attention spans are shrinking, the ability to communicate complex information quickly and clearly has never been more valuable. Enter Infographics Flat Round Icons — a versatile set of vector-based visual assets designed to simplify data storytelling across mobile apps, websites, print, presentations, illustrations, and templates. With a library of 100 vector icons, including 40 specialized icons such as Cylindrical Bars, Vertical Bars, Striped Bars, Horizontal Bar Charts, Rising and Declining Line Graphs, Escalating Bar Graphs, Candlestick Charts, Pie Charts, Venn Diagrams, Radar Charts, Funnel Charts, Pyramid Charts, and Flowcharts, this collection offers a ready-to-use toolkit for professionals who need to present data with clarity and impact.
But beyond the technical specifications — AI, EPS, JPG, PNG, SVG formats, unigrid system design, and cross-platform compatibility — lies a deeper story about how visual communication is evolving. This article explores why Infographics Flat Round Icons are capturing attention, how they fit into broader industry and market trends, and what they reveal about changing workflows, preferences, and expectations in the digital age.
The Rise of Visual Data Communication
Humans are hardwired to process visual information faster than text. Research consistently shows that the brain can interpret images in as little as 13 milliseconds. In a world overflowing with data — from business metrics to social media analytics — the ability to translate numbers into visual stories is a competitive advantage. Infographics Flat Round Icons sit at the intersection of design and data, offering a ready-to-use visual vocabulary that anyone can adopt.
Professionals across industries — marketers, entrepreneurs, freelancers, educators, and product designers — are increasingly expected to communicate insights visually. A quarterly business review, a pitch deck, a product roadmap, or a social media campaign all rely on clear visual cues. The demand for intuitive, scalable, and consistent icon sets has grown steadily as organizations embrace remote collaboration and digital-first communication. Infographics Flat Round Icons address this demand by providing a unified visual language that works across devices and platforms.
Why Flat Round Icons? The Aesthetic and Functional Appeal
The flat design aesthetic has dominated digital interfaces for over a decade. Its clean lines, minimal shadows, and emphasis on usability make it ideal for responsive design. Round icons, in particular, feel approachable and organic — they soften the rigidity of charts and graphs, making data feel less intimidating. The Infographics Flat Round Icons collection embraces this design philosophy, offering a cohesive set of symbols that are both visually pleasing and functionally precise.
What sets this collection apart is its foundation in the unigrid system. Each icon is designed on a consistent grid, ensuring proportional harmony and alignment across the entire set. This attention to detail means that when you combine a Horizontal Bar Chart with a Pie Chart or a Venn Diagram in the same presentation, they feel like part of a single family. For designers and content creators, this consistency reduces cognitive friction and streamlines workflow.
Moreover, the availability of five formats — AI, EPS, JPG, PNG, SVG — means that Infographics Flat Round Icons are truly format-agnostic. Whether you are editing a vector file in Adobe Illustrator for a large-format print or dropping a PNG into a mobile app interface, the icons retain their quality and clarity. This flexibility is critical in a multi-platform world where a single piece of content may be repurposed across a website, a slide deck, and a printed brochure.
The 40 Icons That Cover Every Data Scenario
The collection includes 40 specialized icons that cover a broad spectrum of data visualization needs. These are not generic arrows or abstract symbols; they are specific, ready-to-use representations of real chart types and analytical concepts. Among them:
- Cylindrical Bars, Vertical Bars, Striped Bars, and Horizontal Bar Charts for comparative data.
- Rising Line Graph, Declining Line Graph, and Multiple Line Graph for trends over time.
- Escalating Bar Graph, Rising Economy I & II, Inflation Graph, and Graphical Representation for economic and growth data.
- Scatter Plot I & II, Bell Shaped Graph, Bell Curve on Graph, and Candlestick Chart for statistical and financial analysis.
- Upward Trend in Graph, Horizontal Bars showing Progress, Filled Graph, Column Chart, Stacked Bar Chart, Trend Chart, Stacked Graph, and Multiple Trend Chart for progress and composition.
- Scatter Graph, Pie Chart I & II, Half Pie Chart, Pie Chart Pieces, Marked Donut Chart, Donut Chart, and 3D Pie Chart for proportional data.
- Venn Diagram, Radar Pie Chart, Radar Chart, Funnel Chart, Pyramid Chart, and Flowchart I for relationships, hierarchies, and processes.
This breadth means that whether you are visualizing a sales funnel, a market share breakdown, a product roadmap, or a statistical distribution, there is an icon ready to convey that story. The icons are not just decorative — they are semantic. Each one carries a clear meaning that an audience can instantly recognize, reducing the need for lengthy explanatory captions.
Practical Applications Across Professional Contexts
The versatility of Infographics Flat Round Icons makes them suitable for a wide range of professional scenarios. Consider a few practical examples:
- Mobile Apps: A fitness app might use the Horizontal Bars showing Progress icon to display daily step count, while a finance app could use the Candlestick Chart to show stock performance. The icons' flat round design ensures they render well on small screens without pixelation.
- Websites: A business analytics dashboard can integrate the Rising Line Graph and Stacked Bar Chart icons to summarize key metrics at a glance. The SVG format ensures crisp display on retina screens.
- Presentations: A marketing professional preparing a quarterly review can use the Pie Chart I, Funnel Chart, and Multiple Trend Chart icons to illustrate customer acquisition, conversion rates, and revenue trends. The consistent unigrid design makes the slide deck look cohesive and polished.
- Print Materials: An infographic for a printed report can leverage the 3D Pie Chart and Pyramid Chart icons to add visual interest without overwhelming the reader. The EPS and AI formats allow for high-resolution printing.
- Illustrations and Templates: Content creators can use the icons as building blocks for custom visualizations, combining a Scatter Plot with a Bell Curve to create a unique statistical graphic for a blog post or ebook.
These examples illustrate how Infographics Flat Round Icons bridge the gap between raw data and human understanding. They empower professionals to create visually compelling communications without needing to be expert illustrators or data scientists.
Aligning with Broader Industry and Market Trends
The growing attention on Infographics Flat Round Icons reflects several larger developments in the design, technology, and business landscapes.
The Democratization of Design
Tools like Canva, Figma, and Adobe Express have made design accessible to non-designers. However, the quality of the output still depends on the assets available. High-quality icon sets that are easy to edit and scale democratize professional-grade visual communication. Freelancers and small business owners, who may not have the budget for a dedicated designer, can now produce polished presentations and marketing materials using ready-to-use assets like Infographics Flat Round Icons.
The Data-Driven Culture
Organizations of all sizes are collecting more data than ever before. But data without context is noise. The ability to visualize data effectively is a core competency in modern business. Icons that represent specific chart types and analytical concepts — such as the Inflation Graph, Bell Curve, or Radar Chart — help teams translate metrics into insights more efficiently. This is especially relevant in fields like marketing, finance, healthcare, and education, where data communication is central to decision-making.
The Mobile-First and Multi-Device Reality
Content is consumed on an ever-expanding array of devices — smartphones, tablets, laptops, smartwatches, and even smart displays. Assets that are designed using a unigrid system and available in scalable vector formats (SVG, AI, EPS) ensure consistency across all screen sizes and resolutions. The Infographics Flat Round Icons collection is explicitly built for this multi-device world, making it a practical choice for designers who need to design once and deploy everywhere.
The Remote Work and Asynchronous Communication Shift
Remote and hybrid work have made asynchronous communication — such as recorded presentations, shared dashboards, and collaborative documents — more important than ever. In these contexts, visual clarity is paramount. A well-placed icon can convey a message faster than a paragraph of text. The Infographics Flat Round Icons collection supports this shift by providing a shared visual language that teams can use across time zones and platforms.
Changing Needs and Expectations
Professionals today expect design assets to be immediately usable. Gone are the days of spending hours customizing clip art or redrawing charts from scratch. The demand is for plug-and-play solutions that don't sacrifice quality. Infographics Flat Round Icons meet this expectation by offering a comprehensive set of icons that are ready to use out of the box, with no additional editing required. The five formats ensure that they can be dropped directly into any workflow — whether you're working in Sketch, Illustrator, PowerPoint, or a web-based tool.
Furthermore, the emphasis on maximum usability means that each icon is designed with legibility and recognition in mind. The flat round style reduces visual noise, and the consistent stroke weights and proportions make the icons easy to pair with text and other graphic elements. For busy professionals, this saves time and reduces frustration.
Another key expectation is scalability. As vector-based assets, these icons can be resized without losing quality — from a tiny button on a mobile app to a large graphic on a poster. The unigrid system ensures that when icons are scaled up or down, they maintain their structural integrity and visual balance.
Practical Observations and Best Practices
When using Infographics Flat Round Icons, a few practical considerations can enhance your results:
- Context matters: Choose icons that align with the narrative of your data. For example, use the Rising Economy I icon for growth metrics and the Declining Line Graph for areas needing improvement. The semantic specificity of these icons adds depth to your message.
- Combine with color strategically: The flat round style works well with a limited, intentional color palette. Use color to highlight key data points or to group related icons together.
- Maintain visual hierarchy: In a presentation or infographic, use larger icons for primary data and smaller icons for supporting information. The consistent unigrid design ensures that scaled icons still feel harmonious.
- Blend with other visual elements: These icons pair well with maps, timelines, and typography. For instance, combining a Funnel Chart icon with a numbered list can create a powerful lead-generation infographic.
The Bigger Picture: Visual Consistency as a Trust Signal
In an age of information overload, consistency is a subtle but powerful signal of credibility. When an audience sees a presentation or report that uses a cohesive set of icons, they perceive the content as more professional and trustworthy. Infographics Flat Round Icons provide that consistency out of the box. By using a unified visual language across all your communications, you reinforce your brand's attention to detail and commitment to clarity.
Moreover, the inclusion of both common chart types (like Pie Chart I and Vertical Bars) and specialized visuals (like Candlestick Chart and Bell Curve) means that you can address a wide range of analytical needs without switching between different icon sets. This uniformity reduces the cognitive load on your audience and helps them focus on the insights rather than the visuals.
Conclusion
Infographics Flat Round Icons are more than just a collection of vector graphics. They represent a response to the evolving needs of professionals who must communicate data clearly, quickly, and consistently across an increasingly fragmented digital landscape. With 100 vector icons, 40 specialized data visualization symbols, a unigrid system for consistent design, and five versatile formats, this set offers a practical solution for anyone who creates content for mobile apps, websites, print, presentations, illustrations, or templates.
As data continues to permeate every aspect of business and life, the demand for accessible, high-quality visual communication tools will only grow. Whether you are a marketer presenting quarterly results, an entrepreneur pitching to investors, a freelancer designing a client report, or a product manager mapping a user journey, having a reliable set of visual building blocks can elevate your work and make your insights resonate. Infographics Flat Round Icons deliver that capability with an emphasis on usability, scalability, and aesthetic consistency — making them a valuable asset in the modern communicator's toolkit.
By adopting such tools, professionals not only improve their own efficiency but also contribute to a broader culture of clarity and insight. In a world that is constantly generating data, the ability to visualize it meaningfully is not just a skill — it is a responsibility. And with the right icons, that responsibility becomes a little easier to fulfill.