Process Flow Infographics: Clarity in Every Segment
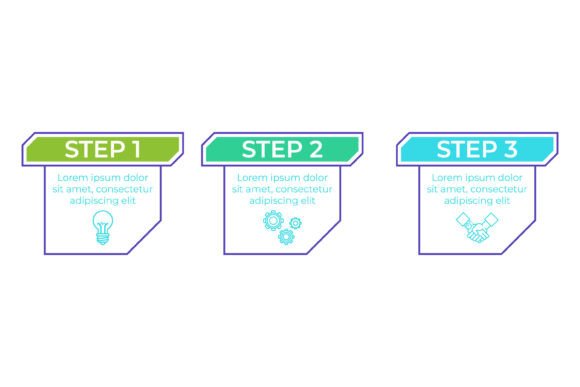
When you land on a well-designed infographic, your eye knows exactly where to go. That is the power of a process flow infographic done right. Now imagine one split into three distinct segments, each labeled with purpose, and each step animated by circular progress indicators that show you exactly how far along you are. This isn’t just a diagram. It is a visual conversation that guides your audience from start to finish without confusion or clutter.
Process flow infographics have been around for years, but the three-segment approach with completion indicators brings a new level of clarity. It breaks down complex information into digestible chunks while giving viewers a tangible sense of progress. Whether you are mapping a workflow, explaining a methodology, or outlining a journey, this format turns abstract steps into something people can see and trust.
What Makes a Three-Segment Process Flow Infographic Stand Out
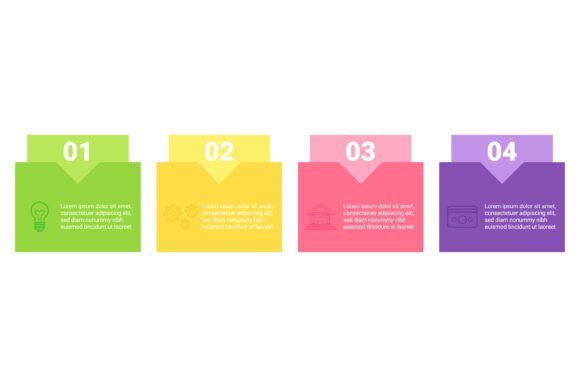
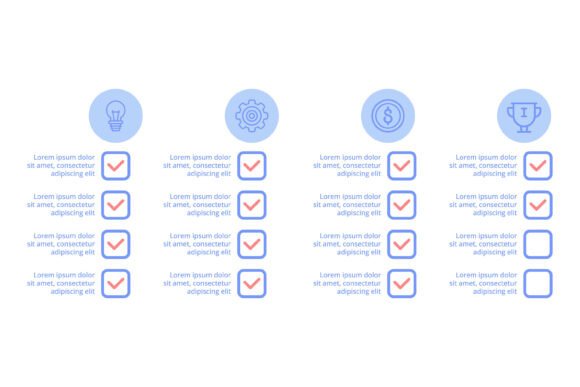
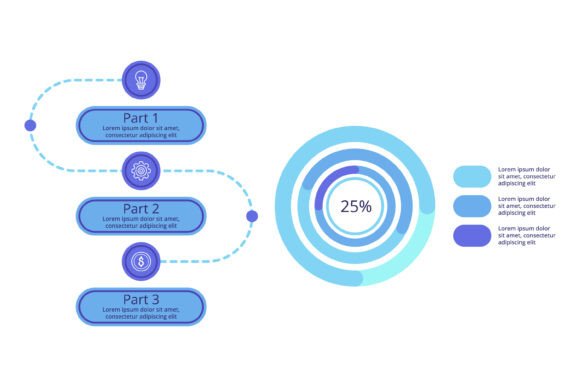
The beauty of this design lies in its structure. Three segments feel complete without being overwhelming. You can think of them as a beginning, middle, and end, or as three pillars of a single concept. Each segment carries its own label, so your audience never has to guess what they are looking at. The circular progress indicators, often shown as half-filled or fully filled circles, visually communicate how much of the process is complete at any stage. This is not decorative. It is functional. People process visual cues faster than text, and a partially filled circle instantly says “we are here, and here is what is next.”
For creators and designers, this format offers a clean canvas. You can use color to differentiate segments, choose icons that reinforce each label, and adjust the size of the progress indicators to match the importance of each step. The result is an infographic that feels alive and responsive, even in a static format. But the real magic happens when you apply it to real-world projects.
Creative Possibilities and Real Applications
Process flow infographics are not limited to one type of user or industry. Their flexibility is what makes them so valuable. Here are several ways different audiences can adapt this three-segment structure for their own goals.
For Marketers Mapping Customer Journeys
Imagine outlining a customer’s experience from awareness to conversion. Segment one could be “Discover,” featuring progress indicators that show how much information a prospect has gathered. Segment two could be “Evaluate,” with indicators reflecting engagement with reviews or demos. Segment three could be “Decide,” where the final circle fills completely when a purchase is made. This gives marketing teams a visual tool to share with stakeholders, showing exactly where drop-offs occur and where messaging needs reinforcement.
For Educators and Trainers Explaining Processes
Teachers and trainers often need to walk learners through multi-step procedures. A three-segment process flow infographic can turn a dry textbook explanation into a memorable visual. For example, in a science class, segment one might cover “Hypothesis,” segment two “Experiment,” and segment three “Conclusion.” The circular progress indicators help students track their own understanding. Each time they complete a phase, they see the circle fill, reinforcing a sense of accomplishment. This is especially useful in online courses where learners move at their own pace.
For Freelancers and Small Business Owners Streamlining Workflows
Freelancers juggle multiple projects with different phases. A process flow infographic can serve as a personal dashboard. Segment one might be “Proposal & Agreement,” segment two “Execution & Revisions,” and segment three “Delivery & Follow-Up.” The progress indicators become a quick visual check on where each project stands. Share it with clients to set clear expectations. When everyone sees the same three phases and knows which circle is half full, communication improves and misunderstandings drop.
For Product Designers and Developers
User onboarding flows, feature rollouts, or sprint cycles fit naturally into a three-segment structure. Segment one could be “Setup,” segment two “Discovery,” and segment three “Mastery.” Progress indicators show new users how far they have come in the onboarding process. This reduces drop-off because people like to complete what they start. Developers can also use the same format to map a feature’s lifecycle from concept to deployment, giving cross-functional teams a shared reference point.
Adapting the Format for Different Platforms
One of the strengths of a process flow infographic is that it scales across media. On a blog, an embedded static version works well, but consider adding hover states that reveal extra information for each segment. On social media, crop the infographic into a carousel where each segment becomes its own slide. The progress indicators then connect the series and encourage viewers to swipe to the next step. For presentations, use the three-segment layout as a slide that builds over time, revealing each segment as you speak.
If you are publishing in a printed report or PDF, ensure your color palette has enough contrast to remain legible in grayscale. Use labels that are readable at small sizes, and consider adding a short caption under each segment to reinforce the visual. The goal is to make the infographic self-sufficient, so even without accompanying text, a reader can grasp the flow.
How to Keep Your Process Flow Infographic Clear and Effective
Clarity is the foundation of any good infographic, but it is especially critical when you are mapping a process. Start by defining the three core stages of your topic. Avoid forcing a topic into three segments if it naturally has four or five. But most workflows, journeys, or explanations can be grouped into three high-level phases. If you find yourself with too many steps, combine smaller actions under one label. For instance, instead of listing ten micro-steps, group them into “Preparation,” “Execution,” and “Review.”
Label each segment with a single word or short phrase. Avoid jargon unless your audience is familiar with it. The progress indicators should be consistent in style throughout the graphic. If you use circles, keep the same radius for all indicators and vary only the fill level. This consistency builds trust. Your audience learns to read the visual language quickly.
Use color strategically. Assign one primary color to each segment and use lighter tints for the progress indicators. This creates a visual hierarchy that guides the eye. For example, segment one could use blue, segment two green, and segment three orange. The progress circles in segment one start empty and fill to blue, segment two fills to green, and so on. This simple system removes guesswork.
Typography also plays a role. Choose one sans-serif font for labels and one for body text if needed. Keep the number of font weights to two or three. Overly fancy fonts can distract from the clarity you are trying to build. Remember, the infographic’s job is to communicate, not to show off every design trick at once.
Keeping It Original and Audience-Friendly
Originality does not mean reinventing the wheel. It means tailoring a proven format to your specific audience. If you are designing for busy executives, keep the segments high-level and use progress indicators that are large and immediately obvious. If your audience is a technical team, add a small annotation under each progress circle with a percentage or a key metric. This extra layer of detail shows you understand their need for precision.
For bloggers and content creators, a three-segment process flow infographic can become a recurring visual signature. Use it to break down how-to guides, explain industry trends, or summarize case studies. Over time, your audience will recognize the format and associate it with clarity. That recognition is valuable. It builds trust and makes your content more shareable.
When adapting for different cultural or language contexts, be mindful of color meanings. For example, green often indicates progress in many cultures, but not universally. Research your audience if you are publishing globally. The same goes for symbols used as icons. A checkmark might mean completion in one region and simply denote a list item in another. Keep icons simple and universal when possible.
Practical Inspiration to Get Started
If you are ready to build your own three-segment process flow infographic, begin with a topic that has a natural progression. Common examples include “Learn, Apply, Share,” “Plan, Execute, Review,” or “Audit, Implement, Monitor.” Sketch each segment on paper first. Draw a circle for each step and decide what level of fill represents completion. Will the circle fill from left to right, or from bottom to top? Both work, but pick one and stay consistent.
Use tools like Canva, Figma, or Adobe Illustrator to create the final graphic. Most template libraries have process flow layouts you can customize. Replace generic icons with ones that match your content. Adjust the progress indicators to reflect the actual completion level of each step in your process. If a step is ongoing, show the circle half-filled. This honesty makes your infographic more credible.
Once created, test the infographic on a small sample from your target audience. Ask them what they think the process is about without reading any supporting text. If they can describe it accurately, your design works. If they hesitate, refine the labels or adjust the progress indicators. This feedback loop is the fastest way to improve.
Process flow infographics with three segments and circular progress indicators are more than a design trend. They are a tool for clear thinking. Whether you are explaining a complex workflow to a client, guiding a student through a lesson, or planning your next creative project, this format gives you structure without stiffness. It respects your audience’s time and attention. And it turns an abstract journey into something they can see, understand, and act on.