Guide to Effective Infographics
Why Visual Clarity Matters More Than Ever
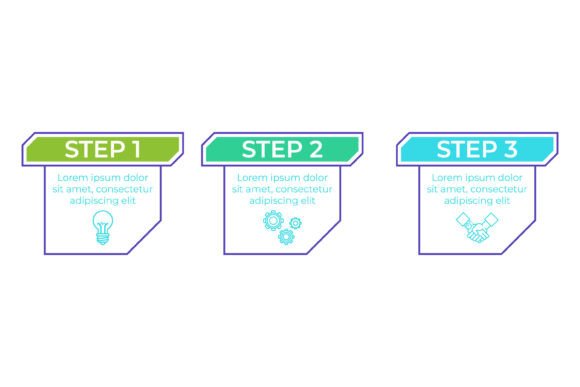
In a world saturated with information, the ability to communicate quickly and clearly is a superpower. The Guide to Effective Infographics steps in as a refreshing antidote to data overload. It is not just another template collection or a design theory lecture. Instead, it offers something profoundly practical: a structured, experience-driven method for turning complex ideas into memorable visuals. At the heart of this guide lies a vivacious infographic that visualizes a three-step process using a trio of unique colors to distinguish each phase. Every step is astutely labeled, coupled with concise descriptions, all curated with the simple objective of facilitating effortless comprehension. This approach embraces simplicity without compromising on the vibrancy and efficiency of your communication.
The Philosophy Behind the Three-Step Visual System
The creators of this guide recognized a common struggle: most people know they need infographics, but few know how to build them with intentional structure. The typical outcome is either a chaotic wall of icons or a boring bullet-point list dressed up with clip art. The Guide to Effective Infographics avoids both extremes by anchoring itself in a three-phase architecture. Each phase is assigned a distinct color — not for decoration, but as a cognitive cue. The colors help your brain compartmentalize information instantly. When you see the first color, you know you are in the foundation stage. The second color signals transformation. The third color points to action or insight. This color-coding removes guesswork and lets you focus on the message itself.
Phase One: Establishing the Foundation (Color One)
The first phase in the Guide to Effective Infographics is all about gathering and simplifying your raw material. Whether you are working with survey data, step-by-step instructions, or comparative analysis, this stage helps you strip away noise. The accompanying infographic uses a calm, grounding color for this phase — often a deep blue or a warm neutral — to signal stability. The labeling is direct: you are asked to identify your core message, select no more than three supporting points, and discard anything that does not serve the narrative. What makes this phase so effective is its honesty. It forces you to acknowledge what your audience truly needs to know, rather than what you want to say.
In practice, this phase works beautifully for project managers explaining workflows, educators breaking down historical events, or marketers outlining product benefits. The concise description that accompanies this step reads something like: "Identify your single most important takeaway. Everything else either supports it or gets cut." That level of directness is rare in most communication guides, and it is exactly what makes this one so valuable.
Phase Two: Building Visual Flow (Color Two)
The second phase introduces a contrasting, energetic color — perhaps a vibrant orange or a lively green. This color signals transition and movement. Here, the Guide to Effective Infographics teaches you how to arrange your simplified content into a visual hierarchy. The infographic does not assume you are a designer. Instead, it offers straightforward rules: place the most important element at the top or center, use directional cues like arrows or gaze lines, and keep white space as an active design element. The labeling for this step emphasizes flow: "Connect each piece so the eye moves naturally from start to finish."
What sets this phase apart is its practicality. It acknowledges that most people will be using basic tools like Canva, PowerPoint, or even hand-drawn sketches. You do not need expensive software to apply these principles. The vivacious infographic that accompanies the guide shows real before-and-after examples of the same data — first as a cluttered paragraph, then as a clean, color-coded visual journey. This side-by-side comparison is worth a thousand words of explanation. It demonstrates that effective infographics are not about artistic talent; they are about logical sequencing.
Phase Three: Refining for Impact (Color Three)
The final phase uses a bold, attention-grabbing color — such as a bright red, deep purple, or striking gold — to signify completion and call to action. At this stage, the Guide to Effective Infographics focuses on polish and persuasive power. The infographic's labeling for this step is clear: "Review for clarity, check for accuracy, and ensure your audience knows what to do next." This phase addresses the often-overlooked gap between understanding and action. A beautiful infographic that does not drive a decision or a realization is just decoration. The guide pushes you to ask hard questions: Does the title tell the story? Is the data source visible? Does the color combination remain accessible to colorblind viewers?
This is also where the guide's commitment to inclusive design becomes apparent. The trio of colors is chosen not only for contrast but also for accessibility. The guide recommends checking contrast ratios and avoiding reliance on color alone to convey meaning. Labels and patterns supplement the hues, so your message stays crystal clear even in grayscale printouts. That level of thoughtfulness is what separates a professional-grade infographic from an amateur attempt.
Real-World Scenarios and Applications
The beauty of the Guide to Effective Infographics is its versatility. Let us look at a few scenarios where this three-step process shines.
- Small Business Owners: Imagine you run a local bakery and want to explain your sourdough process. Using the guide, you identify one key message (slow fermentation builds flavor), simplify the steps to three, arrange them in a left-to-right flow, and end with a call to action: "Taste the difference today." The result is a menu infographic that educates and sells simultaneously.
- Corporate Trainers: A manager needs to onboard new hires on safety protocols. The guide helps distill a thirty-page manual into a one-page visual. The three colors map to "Identify Hazard," "Respond Correctly," and "Report Outcome." New employees grasp the system in minutes instead of hours.
- Freelance Designers: A graphic designer uses the guide as a client communication tool. Instead of endless revisions, they present the three-phase framework to set expectations. Clients see exactly where their input is needed (phase one) and where creative freedom applies (phase two). This reduces revision cycles by nearly half.
- Nonprofit Advocates: A charity explaining its impact uses the guide to show the problem (phase one), the intervention (phase two), and the quantified outcome (phase three). Donors understand the narrative in a single glance, making them more likely to contribute.
- Students and Educators: A high school teacher uses the guide to help students create infographics for science projects. The three-color system becomes a grading rubric: foundation (research quality), flow (logical organization), and impact (clarity of conclusion). Students produce work that is easier to evaluate and more rewarding to create.
Strengths, Considerations, and Practical Limitations
No tool is perfect for every situation, and the Guide to Effective Infographics is no exception. Its greatest strength is its simplicity without dumbing down. The three-phase structure is intuitive enough for a beginner yet rigorous enough for a professional. The color-coding system reduces cognitive load and makes collaboration easier — you can literally say "let's work on the green section" and everyone knows what you mean.
However, there are considerations to keep in mind. The guide assumes you have a single, clear message to communicate. If your project involves highly nuanced, interconnected datasets — like a scientific research paper with multiple variables — the three-phase model may feel constraining. In those cases, you might need to adapt the framework by nesting sub-steps within each phase. The guide does not explicitly address this, but the principles still apply: simplify, sequence, and highlight.
Another limitation is the reliance on visual design tools. While the guide itself is platform-agnostic, users who lack basic familiarity with design software may struggle to execute the visual elements. The guide provides conceptual clarity, but it does not include step-by-step software tutorials. That said, the core lessons about hierarchy, color, and flow transfer easily to any tool — even a whiteboard and markers.
It is also worth noting that the vivacious infographic that accompanies the guide is a single example. It brilliantly illustrates the three-step process, but users should not treat it as a rigid template. The colors, layouts, and labels are adaptable. The real value lies in the systematic approach, not the specific visual execution. Users who understand this will get the most out of the guide.
How to Evaluate If This Guide Is Right for You
Ask yourself a few questions before diving in. Do you often struggle to explain ideas visually? Do you find yourself adding too much text to slides or posters? Do you want your audience to remember your message days later rather than minutes later? If the answer to any of these is yes, the Guide to Effective Infographics is likely a strong fit.
On the other hand, if you are already an experienced data visualization professional comfortable with tools like Tableau or D3.js, the guide may feel basic. However, even seasoned designers report that the three-phase color system helps them communicate with clients more clearly. The guide functions as a shared language between creator and stakeholder, which is valuable at any skill level.
For those working in highly regulated industries — like healthcare or finance — the guide's emphasis on accuracy and accessibility is particularly relevant. The third phase's focus on verification and inclusive design aligns perfectly with compliance requirements. You can use the framework to create infographics that are both engaging and legally sound.
Final Thoughts on Embracing Simplicity and Vibrancy
The Guide to Effective Infographics succeeds because it respects both the creator and the audience. It does not ask you to become a graphic designer. It asks you to think clearly, organize honestly, and present generously. The trio of colors is not a gimmick; it is a mental shortcut that turns the abstract process of communication into a concrete, repeatable system. Whether you are crafting a social media post, a business proposal, an educational handout, or a nonprofit appeal, this guide gives you a reliable path from confusion to clarity.
Experience clarity like never before with the vivacious infographic at the guide's core. It effortlessly visualizes the three-step process using a trio of unique colors that distinguish each phase. Every step is astutely labeled and paired with concise descriptions, all curated with the simple objective of making comprehension effortless. You can embrace simplicity without sacrificing the vibrancy and efficiency of your communication. In a noisy world, that is not just helpful — it is essential.
If you are ready to transform the way you share information, let this guide be your starting point. Apply its principles to your next project, and watch your audience move from confused to convinced in a single glance.