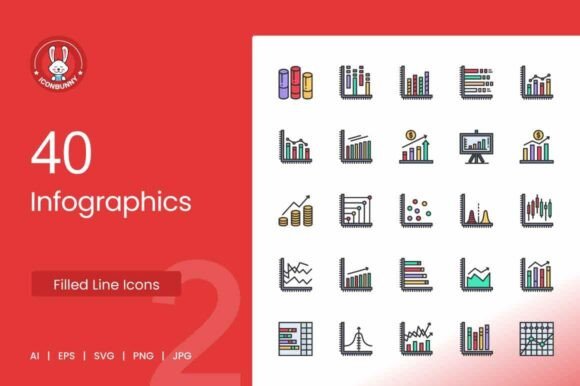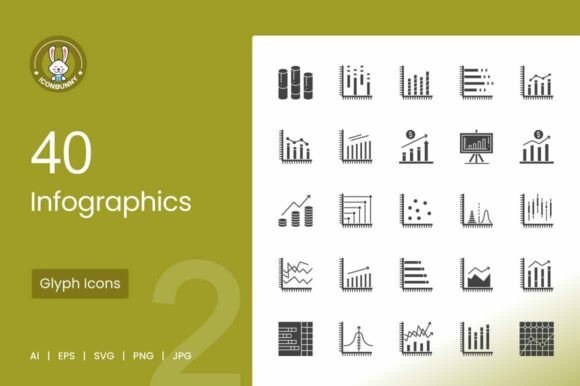
Infographics Glyph Icons: A Versatile Set for Every Visual Communication Need
You know that feeling when you’re building a dashboard or designing a presentation slide, and you need a chart icon that instantly communicates the data story? Not a generic arrow or a box, but something that actually looks like a bar chart, a funnel, or a scatter plot. That’s exactly where Infographics Glyph Icons step in. This is a ready-to-use collection of 100 vector icons designed around the most common data visualization shapes, from vertical bars and pie charts to radar graphs and flowcharts. And because it comes in five different formats—AI, EPS, JPG, PNG, and SVG—you can drop these into almost any project without worrying about compatibility.
What makes this set really stand out is the unigrid system behind it. Every icon shares the same spatial rhythm, so when you place a cylindrical bar next to a bell curve, they feel like they belong together. No awkward resizing, no mismatched line weights. That’s a massive time-saver when you’re working on a mobile app interface, a print infographic, or a multi-slide presentation where consistency matters.
Real-World Scenarios Where These Icons Shine
Let’s talk about where you’ll actually use these. If you build mobile apps, you know that small screen real estate demands clarity. A pie chart icon or a half-donut icon can sit in a bottom navigation bar or a stats widget, giving users an instant visual cue. The same icons work beautifully in a responsive web dashboard—SVG format keeps them crisp on retina displays, and the EPS version lets you tweak colors to match your brand palette before exporting.
For print projects, especially in business reports or marketing materials, the JPG and PNG variants offer a quick paste-and-print solution. But because the source files are vector, you can also scale the funnel chart or pyramid chart to fit a full-page infographic without losing quality. I’ve seen designers use the candlestick chart icon in financial newsletters and the striped bars in quarterly reviews—both get the point across without needing a full chart generator.
Presentations are another sweet spot. Instead of hunting through stock image libraries for a cluttered chart screenshot, you can insert a clean rising line graph or declining line graph icon right into a slide deck. It saves time and keeps the focus on your narrative, not on the graphic itself. Teachers and trainers often use the bell-shaped graph and scatter plot icons in educational materials to illustrate statistical concepts without overwhelming learners with raw data.
Who Benefits Most from This Icon Set
UX/UI designers working on analytics platforms will find the radar chart and radar pie chart icons invaluable for performance dashboards. They give users a visual shorthand for complex metrics like “skill scores” or “multi-factor comparisons.” Similarly, product managers who craft feature demos or wireframes can use the stacked bar chart and column chart icons to represent growth or segmentation without building actual charts yet.
Content creators and bloggers writing about finance, economics, or business trends often need to sprinkle data visuals into articles. The inflation graph, rising economy, and multiple trend chart icons are practically tailored for that. Drop an SVG into your CMS, and it scales automatically. No need to rely on screenshots that look pixelated on mobile.
Presentation designers and trainers frequently need to simplify complex information. The flowchart icons (Flowchart I and II in the set) are great for process diagrams, while the Venn diagram and funnel chart help illustrate overlap or conversion stages. Because the icons are built on a unigrid, you can mix and match them across slides without worrying about visual noise.
Even non-designers—say, a team lead preparing a status report—can benefit. The PNG files are ready to drop into Word docs or Google Slides. The JPG versions work for quick email attachments. You don’t need to open Illustrator or Figma if you just want a horizontal bar showing progress icon next to a KPI.
Practical Observations from Using Icon Sets Like This
One thing I’ve noticed is that the 5 different formats cover almost every workflow. If you’re working in Adobe Illustrator, the AI files let you edit the shapes directly—change stroke thickness, apply gradients, or combine icons into a custom composite. EPS files are great for legacy layout tools like CorelDRAW or older versions of InDesign. SVG is the go-to for web and app development, while PNG and JPG are instant-use for mockups or social media graphics.
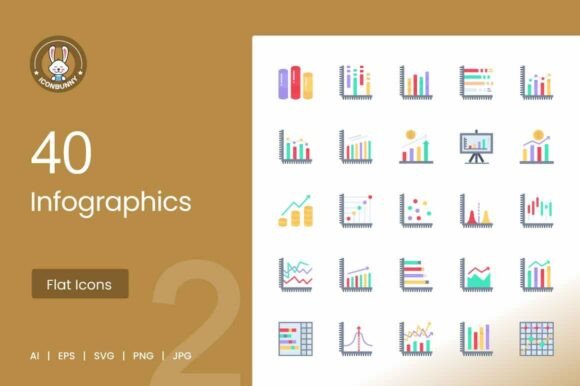
The 100 vector icons count means you have plenty to illustrate a full data-driven story. Besides the 40 examples listed—like cylindrical bars, vertical bars, half pie charts, doughnut charts, and 3D pie charts—you’ll find variations that cover different chart types. But here’s a practical consideration: not every icon type will be useful for every project. For instance, the candlestick chart is specific to stock market analysis; if you never deal with financial data, you might skip it. On the flip side, the rising economy and declining graph are so generic that they fit almost any “growth” or “decline” context.
Another observation: the unigrid system is a double-edged sword. It ensures visual harmony, but because all icons share the same proportional logic, some very dense shapes (like a filled graph or a multiple trend chart) can look a bit small when displayed at icon size (say, 24x24 pixels). That’s totally fine for web or mobile UI, but if you’re using them in a poster or a large print, you’ll want to scale them up—which the vector formats handle flawlessly.
Common Considerations Before Choosing or Applying These Icons
First, check your specific needs against the list of 40 icon types mentioned. Are you looking for a striped bar or a vertical bar? Both are included, but a stacked bar chart and a horizontal bar chart are also present. If you need a pie chart, you get multiple options: Pie Chart I, Half Pie Chart, Pie Chart II, and 3D Pie Chart. That’s enough variety to avoid repeating the same icon everywhere.
Second, think about color and styling. The icons are delivered as glyph-style (likely monochrome or outline), which is great for modern UI. But if your project requires filled or multicolored icons, you’ll need to edit the AI or SVG files. The easy to edit and scale promise holds, but be prepared to spend some time on customization if you need a specific brand color.
Third, format compatibility: while all five formats cover most use cases, some platforms (like Notion or Canva) prefer SVG or PNG. And if you’re using a tool that doesn’t support vector files natively, the JPG or PNG fallback works. Just keep in mind that JPG compression can introduce artifacts if you use it at a very small size—prefer PNG for crispness.
Finally, remember that this set is designed for maximum usability. The icons are intentionally simplified—they’re not meant to replace full data visualization tools. You wouldn’t use the scatter plot icon to plot actual data points; you’d use it as a label or a navigation element. That’s the sweet spot these icons live in: wayfinding, concept illustration, and visual shorthand.
Whether you’re designing a mobile app, a website dashboard, a printed report, or a presentation, having a consistent library of infographic glyphs saves hours of searching and tweaking. And with the 40 specific types listed—from cylindrical bars to flowchart variants—you likely have the building blocks for most data-related visual communication needs.