Infographics Filled Line Icons: A Strategic Tool for Clear Communication and Visual Impact
In a world saturated with data, the ability to communicate complex information quickly and clearly is a competitive advantage. Whether you are preparing a pitch, designing a dashboard, or building a mobile app, the visual language you choose either clarifies or confuses. Infographics Filled Line Icons represent a thoughtfully crafted set of visual assets designed to bridge the gap between raw numbers and meaningful insight. This collection of 100 vector icons, available in five formats and built on a unigrid system, offers more than decoration—it provides a structured vocabulary for presenting trends, comparisons, and relationships.
Understanding what this set contains and how to deploy it intentionally can improve your communication workflows, support decision-making, and strengthen brand consistency. The following sections explore strategic use cases, practical planning considerations, and the potential pitfalls of using visual assets without a clear purpose.
What Infographics Filled Line Icons Offer Beyond Aesthetics
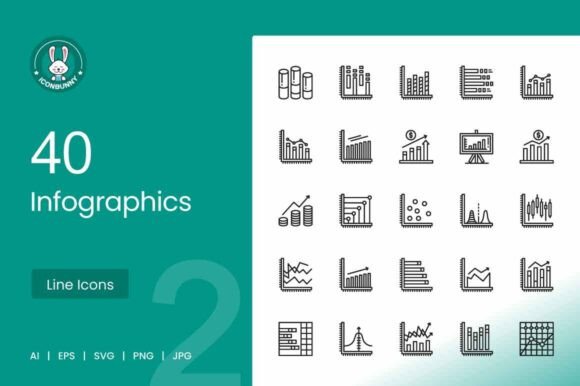
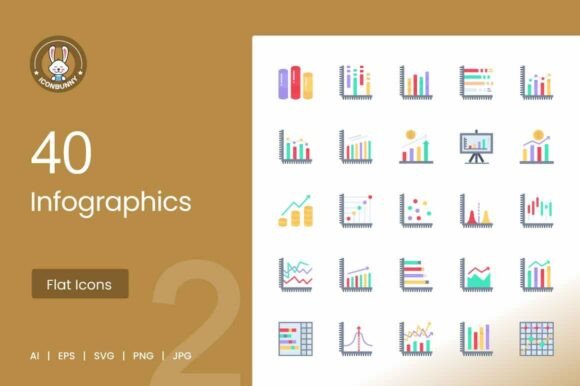
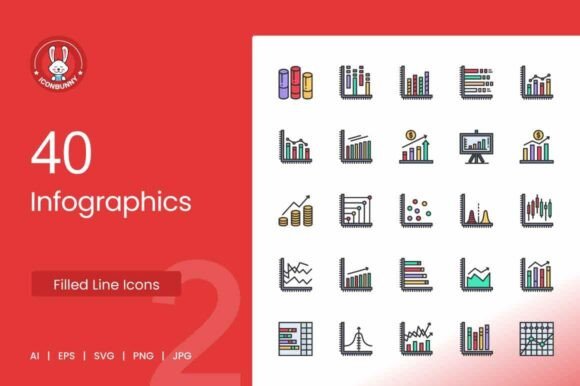
At first glance, this icon set appears to be a collection of standard charts and graphs: cylindrical bars, vertical bars, pie charts, line graphs, scatter plots, and pyramid diagrams. However, the strategic value lies in the systematic design behind them. Each icon is constructed on a unigrid, meaning every element aligns to a consistent spatial framework. This consistency becomes critical when you need to maintain visual harmony across a presentation, a website interface, or a printed report.
The set includes 40 specific infographic icon concepts—ranging from Rising Economy I and Declining Line Graph to Venn Diagram, Funnel Chart, and Flowchart I—each designed to represent a distinct data narrative. Because they come in AI, EPS, JPG, PNG, and SVG formats, you can use them across virtually any platform or device without rework. This cross-format readiness saves time and reduces friction when moving from design to development to print.
For entrepreneurs and small business owners, this means you are not locked into a single workflow. A markdown deck, a mobile app interface, and a printed brochure can all share the same visual language, reinforcing brand recognition and message clarity.
Why the Unigrid System Matters for Long-Term Use
The unigrid design methodology ensures that every icon occupies a consistent visual footprint. When you place a Horizontal Bar Chart next to a Multiple Line Graph, the proportions feel intentional rather than accidental. Over time, this consistency builds trust with your audience. They may not consciously notice the grid, but they will notice the coherence. For brands that publish frequently—blogs, social media content, or client reports—this coherence reduces cognitive load and helps readers focus on the data story rather than the visual noise.
Strategic Applications for Entrepreneurs, Marketers, and Creators
The true power of Infographics Filled Line Icons emerges when you align their use with specific goals. Here are several strategic scenarios where this icon set can support better outcomes.
Improving Presentation Clarity and Audience Retention
Presentations often fail not because the data is wrong, but because the audience cannot process it quickly. A Candlestick Chart or Stacked Bar Chart rendered as a clean icon can simplify a complex financial trend into an instantly recognizable shape. When you replace dense spreadsheet screenshots with these icons, you give your audience a mental shortcut.
Consider a quarterly review with stakeholders. Instead of showing a raw table of revenue fluctuations, use the Rising Economy II icon alongside a brief trend annotation. The icon signals upward movement before anyone reads a single number. This pre-attentive processing—where the brain recognizes shapes before details—speeds comprehension and leaves more mental energy for discussion.
Supporting User Interface Design Without Overwhelming Users
Mobile app designers and web developers face a constant tension: provide enough visual information to guide users, but not so much that the interface feels cluttered. A Radar Chart icon can represent a performance overview in a fitness app without requiring a live chart on every screen. A Donut Chart icon can indicate budget breakdowns in a finance app, allowing users to tap for details when needed.
Because these icons are vector-based and scalable, they render crisply on any screen size. The Filled Graph icon, for example, works as a small touch target on mobile while maintaining legibility on a desktop dashboard. This flexibility reduces design iteration cycles and helps product teams ship faster without sacrificing quality.
Enhancing Print and Presentation Materials for Credibility
Printed materials—whether proposals, white papers, or conference posters—benefit from visual hierarchy. A Pyramid Chart icon can illustrate a hierarchical process more elegantly than a bulleted list. A Funnel Chart icon can show a sales pipeline or lead conversion flow in a single glance. When these icons are consistently styled, your printed collateral looks professional and deliberately crafted, which increases perceived trustworthiness.
For educators and trainers, the ability to reuse the same visual language across handouts, slides, and online modules creates a cohesive learning experience. Students spend less time decoding inconsistent graphics and more time absorbing the material.
Planning Your Visual Strategy: When and How to Use the Icons
Intentional use of Infographics Filled Line Icons requires a plan. Randomly dropping icons into a document may create visual confusion rather than clarity. Here is a practical framework for deciding when and where to deploy them.
Mapping Icons to Narrative Goals
Before selecting an icon, ask: What story am I telling with this data point? If you are showing progress toward a goal, the Horizontal Bars showing Progress icon reinforces the idea of completion. If you are contrasting two periods, the Multiple Trend Chart icon sets up the comparison visually. If you are illustrating cause and effect, the Flowchart I icon can map the sequence.
This mapping turns the icon set into a visual shorthand. Your audience does not need to read every label to understand the direction of the argument. They see the shape and infer the meaning, which accelerates comprehension and retention.
Creating a Consistent Visual Vocabulary Across Channels
One of the most overlooked strategic advantages of a unified icon set is brand consistency. When your website uses the same Pie Chart I icon as your annual report and your mobile app, you reinforce a cohesive identity. Over time, audiences associate that specific visual style with your brand’s reliability and attention to detail.
To achieve this, create a simple usage guide for your team. List which icons correspond to which recurring concepts—for example, use Bell Shaped Graph for normal distribution examples, Scatter Plot I for correlation discussions, and 3D Pie Chart for proportional breakdowns. This reduces decision fatigue and ensures that even new team members produce on-brand visuals quickly.
Balancing Icon Use with Real Data Visualization
It is important to note that these icons are representational, not actual data-driven charts. They are visual cues that stand in for real graphs, not replacements for accurate data visualization. Use them as entry points, summaries, or section dividers. When the audience needs to analyze precise figures, pair the icon with a real chart or a clear numerical annotation. This combination—an icon for orientation and a chart for detail—creates a powerful information hierarchy.
Risks of Using Infographics Filled Line Icons Without Clear Goals
As with any design resource, using these icons without a strategic intention can backfire. Understanding these risks helps you avoid common mistakes.
Visual Clutter Rather Than Clarity
When icons are added to a layout without a consistent grid or hierarchy, they compete for attention. A slide with five different chart icons—each representing a different data point—can overwhelm the viewer. The human brain processes visuals faster than text, but only when the visuals are organized. If every icon fights for prominence, none of them communicate effectively.
To prevent this, limit each page or screen to one or two icons that support the primary message. Let the icons serve as anchors, not distractions.
Misalignment Between Icon Meaning and Data Reality
If you use a Rising Economy I icon to represent a declining metric, you create cognitive dissonance. Audiences may subconsciously associate the icon with growth, even if the text says otherwise. This misalignment erodes trust and can confuse viewers who scan visually before they read.
Always match the icon’s implied direction to the actual trend. Use Declining Line Graph for downturns, Escalating Bar Graph only when values are genuinely increasing, and Inflation Graph specifically for contexts involving cost or price changes. Treat each icon as a semantic label, not a decorative filler.
Over-Reliance on Icons at the Expense of Context
Icons simplify, but they cannot replace context. A Scatter Plot II icon tells the audience that correlation exists, but it does not tell them the variables, the sample size, or the significance. If you use icons as substitutes for explanation, you risk leaving your audience with a vague impression rather than actionable understanding.
The best approach is to use icons as cues that point toward deeper information. Pair them with a brief headline, a key number, or a call to action that invites further exploration. This way, the icon does the work of orienting, while the surrounding content delivers the substance.
Practical Decision-Making Guidance for Different Roles
Different professionals will extract different value from this icon set. Here is how to approach it based on your primary role.
For Marketers and Content Creators
Use these icons to create visual anchors in blog posts, social media graphics, and email newsletters. A Column Chart icon next to a statistic draws the eye and increases the likelihood that the reader pauses on that data point. Test different icon placements to see which combinations drive engagement. Because the icons are available in PNG and JPG, they integrate easily into content management systems without heavy file sizes.
For Freelancers and Small Business Owners
You often work with limited time and budget. Having a single icon set that works across print, web, and presentations saves you from sourcing and reconciling different design styles. The SVG format is particularly useful for responsive websites, where icons must scale without losing quality. Invest a few hours upfront to build a template library using these icons, and you will shorten future project cycles significantly.
For Educators and Trainers
Consistent visuals aid learning. Create handouts that use the same Bell Curve on Graph icon that appears in your slide deck and online module. This repetition reinforces the concept across different learning touchpoints. The Venn Diagram and Flowchart I icons are especially useful for process-based subjects where students need to see relationships and sequences clearly.
For Product Teams and UI Designers
Incorporate these icons into your design system from the start. Because they follow a unigrid, they align well with other grid-based UI components. Use the Marked Donut Chart icon as a placeholder on dashboards during wireframing, then replace it with live data later. The consistency of the set means that placeholder icons do not distract during user testing, allowing participants to focus on functionality rather than visual inconsistencies.
Long-Term Value: Building a Visual Library That Endures
The most compelling reason to invest time in Infographics Filled Line Icons is the durability of the asset. Vector files do not degrade. The unigrid system ensures that every new icon you add or adapt maintains proportional harmony. As your business or project grows, you can extend this visual language without starting over.
Think of this icon set as a foundation, not a one-off purchase. Over months and years, you will develop a library of templates, dashboards, and presentation decks that all speak the same visual dialect. That consistency reduces cognitive friction for your audience and strengthens your professional reputation.
When you approach these icons with a strategic mindset—mapping them to narrative goals, using them sparingly, and pairing them with clear context—you transform them from mere decoration into a genuine communication asset. The icons themselves are static; the value comes from how you choose to deploy them.
In a time when attention is scarce and data is abundant, the ability to distill complexity into a recognizable shape is not just a design skill—it is a strategic advantage. Infographics Filled Line Icons give you the raw material. Your judgment and planning determine whether that material becomes clarity or noise.