Infographics Flat Multicolor Icons: A Versatile Toolkit for Modern Visual Communication
In an age where audiences scroll past text-heavy content in under three seconds, the ability to convey complex data quickly and clearly has become a non-negotiable skill. Whether you are building a mobile app dashboard, designing a slideshow for stakeholders, or creating marketing materials for a brand launch, the visual language you choose directly affects how your message is received. Infographics Flat Multicolor Icons represent more than a collection of decorative shapes—they are a practical, ready-to-use system designed to help professionals and creators turn raw numbers into compelling stories. With 100 vector icons covering everything from cylindrical bars to radar charts, this set addresses a growing need for consistency, usability, and cross-platform compatibility in visual communication.
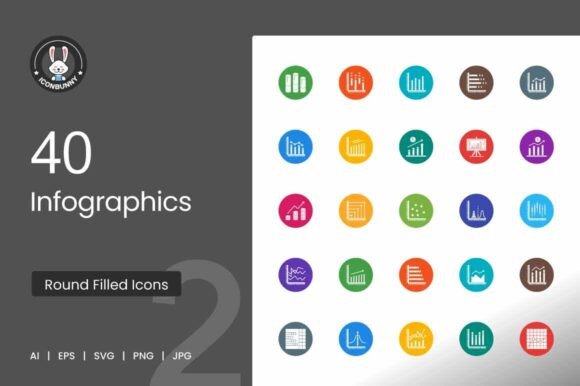
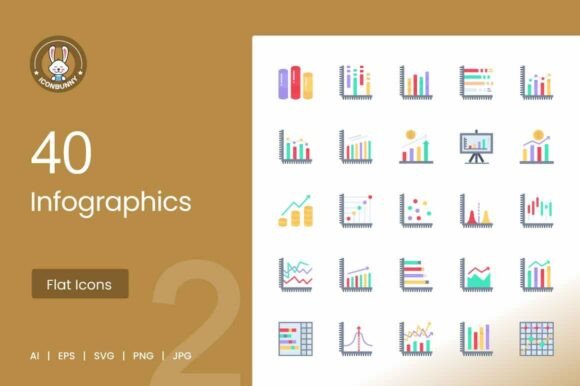
The relevance of such a toolkit extends far beyond graphic design studios. Entrepreneurs building pitch decks, educators preparing course materials, bloggers explaining market trends, and freelancers crafting client reports all face the same challenge: how to make data approachable without sacrificing accuracy. The set includes 40 specific infographic icons—Cylindrical Bars, Vertical Bars, Striped Bars, Horizontal Bar Chart, Rising Line Graph, Declining Line Graph, Escalating Bar Graph, Rising Economy I and II, Graphical Representation, Inflation Graph, Scatter Plot I and II, Bell Shaped Graph, Candlestick Chart, Multiple Line Graph, Upward Trend in Graph, Horizontal Bars showing Progress, Filled Graph, Column Chart, Stacked Bar Chart, Bell Curve on Graph, Trend Chart, Stacked Graph, Multiple Trend Chart, Scatter Graph, Pie Chart I and II, Half Pie Chart, Pie Chart Pieces, Marked Donut Chart, Donut Chart, 3D Pie Chart, Venn Diagram, Radar Pie Chart, Radar Chart, Funnel Chart, Pyramid Chart, and Flowchart I. Each icon is purpose-built to save time, reduce friction, and help you focus on the story your data is telling.
Why Flat Multicolor Icons Are Reshaping Visual Communication
The shift toward flat multicolor iconography is not a passing aesthetic preference—it reflects deeper changes in how people consume information on screens. Over the past decade, user interfaces have moved away from skeuomorphic textures toward cleaner, more approachable visuals. Flat icons reduce cognitive load by stripping away unnecessary detail, while the strategic use of multiple colors helps viewers distinguish between data sets, categories, or trends at a glance. This is especially important when presenting information to audiences who may not have a background in data analysis.
The Infographics Flat Multicolor Icons set takes this philosophy further by applying a unigrid system to every icon in the collection. A unigrid ensures that all icons share consistent proportions, spacing, and visual weight, so they work harmoniously whether you use them in a mobile app interface or a printed poster. This level of coherence is difficult to achieve when mixing icons from different sources, and it is one of the reasons professionals are paying more attention to curated, system-based icon sets instead of building libraries piece by piece.
Modern workflows demand flexibility. You might start designing a presentation on your laptop, review it on a tablet, and share it with a client who views it on a smartphone. The icons in this set are designed to be ready to use for all devices and platforms, with five different formats—AI, EPS, JPG, PNG, SVG—included from the start. SVG and EPS formats are particularly valuable for scaling without pixelation, while PNG and JPG offer quick insertion into documents or slides. AI files give advanced users full control over color and composition in Adobe Illustrator. This range of formats eliminates the common headache of converting or recreating assets for different use cases.
Practical Benefits for Creators and Professionals
One of the most overlooked aspects of icon design is usability. An icon that looks beautiful in isolation may fail when placed next to text or other graphics. The Infographics Flat Multicolor Icons set addresses this by designing each icon for maximum usability, meaning the shapes, line weights, and color contrasts are optimized for legibility at various sizes. Whether you scale an icon down to a 24-pixel mobile button or enlarge it for a banner, the visual clarity remains intact.
For marketers and business owners who produce reports, blog posts, or social media visuals, having a cohesive set of 100 vector icons means you can maintain a consistent brand language across all channels. Instead of spending hours searching for the right chart icon or bar graph symbol, you have every common infographic element—from a Funnel Chart to a Pyramid Chart to a Flowchart—available in one place. This consolidation speeds up production cycles and reduces the creative friction that often delays content publishing.
Educators and trainers can use icons like the Bell Curve on Graph, Scatter Plot I and II, or the Multiple Line Graph to build clear, repeatable visual aids for lessons on statistics, economics, or business trends. Because the icons are easy to edit and scale, instructors can adapt them for different proficiency levels or highlight specific data points without starting from scratch.
Trends Driving the Demand for Ready-to-Use Infographic Icons
The rise of data-driven decision-making in almost every field has created a parallel need for data visualization skills among non-designers. A small business owner analyzing quarterly sales, a freelance writer creating an annual review post, or a project manager updating a team dashboard—all benefit from visuals that communicate trends faster than text. However, not everyone has the time or expertise to design custom charts and graphs from zero. Pre-made infographic icons bridge that gap, offering professional-level visuals with minimal effort.
Another trend is the growing expectation for cross-platform consistency. Audiences interact with content on phones, tablets, laptops, and even smart displays. An icon set that provides 5 different formats and guarantees compatibility across devices meets the demand for seamless experiences. The inclusion of AI and EPS files also supports collaborative workflows where design teams need editable vector sources for further customization.
The move toward accessible design has also influenced icon creation. High-contrast colors and clear silhouettes help ensure that your infographics are readable for people with visual impairments or color vision deficiencies. Flat multicolor icons, when constructed carefully, can enhance accessibility without relying solely on color to convey meaning—a principle that aligns with modern web standards and inclusive design practices.
How the 40 Specific Icons Cover Key Visualization Needs
The list of 40 icons included in this set reads like a comprehensive glossary of data visualization types. For financial data, you have Candlestick Chart, Inflation Graph, Rising Economy I and II, and Stacked Bar Chart. For comparisons, you can turn to Vertical Bars, Striped Bars, Horizontal Bar Chart, and Column Chart. Trend analysis is covered by Rising Line Graph, Declining Line Graph, Multiple Trend Chart, Upward Trend in Graph, and Trend Chart. Proportion and distribution visuals include Pie Chart I and II, Half Pie Chart, Pie Chart Pieces, Marked Donut Chart, Donut Chart, 3D Pie Chart, Venn Diagram, and Radar Pie Chart.
Flow and process diagrams are represented by Funnel Chart, Pyramid Chart, and Flowchart I. For statistical and analytical graphics, you have Scatter Plot I and II, Bell Shaped Graph, Bell Curve on Graph, Scatter Graph, Radar Chart, and Graphical Representation. Progress tracking is made easy with Horizontal Bars showing Progress and Filled Graph. This breadth means you can handle everything from a simple blog infographic to a detailed investor report using a single, visually coherent set.
Practical Implications for Everyday Use
Imagine you are a freelancer preparing a monthly analytics report for a client. Instead of opening three different software tools to generate charts, you can use Multiple Line Graph icons to show traffic trends, Stacked Graph icons to break down audience segments, and Donut Chart or Pie Chart Pieces to illustrate revenue distribution. Because all icons are formatted in PNG and SVG, you can drag them directly into a Google Doc, a Canva template, or a PowerPoint slide without worrying about resolution or background mismatches.
For entrepreneurs building a mobile app prototype, the Rising Economy I and Escalating Bar Graph icons can serve as placeholder visuals during wireframing and then be replaced with the same icons—scaled and color-adjusted—in the final design. The unigrid system ensures that icons placed next to buttons or labels maintain consistent visual rhythm, which is critical for polished user experiences.
Educators preparing online course materials can use the Flowchart I icon to explain decision trees, the Venn Diagram to compare concepts, and the Bell Curve on Graph to teach statistical distributions. Having these icons ready in AI or EPS format allows instructors to customize colors to match their course branding or to highlight specific elements for different lessons.
Recommendations for Getting the Most Out of the Set
To maximize the value of Infographics Flat Multicolor Icons, consider organizing the 100 vector icons into themed folders or collections based on your recurring projects. For instance, group all bar and line graph icons into one folder for financial reports, and keep process-oriented icons like Funnel Chart, Pyramid Chart, and Flowchart I in another for workflow diagrams. Use the SVG format for web projects to keep file sizes small and scalability infinite. When printing, opt for EPS or AI formats to preserve crisp lines and vibrant colors.
Experiment with color schemes that align with your brand palette, but be mindful of accessibility. The multicolor design of these icons provides enough contrast to work well on light and dark backgrounds alike. If you use them in mobile apps, test legibility at small sizes—the unigrid system typically ensures clarity, but checking real-world display conditions is always good practice.
Finally, take advantage of the fact that these icons are easy to edit and scale. Do not hesitate to combine icons, adjust their orientation, or overlay text to create hybrid visuals. For example, overlaying a Trend Chart icon on a Column Chart background can produce a richer infographic element than either icon alone. The flexibility of vector files makes such experimentation quick and reversible.
Looking Ahead: Why This Approach to Icons Matters
The way we communicate data is evolving, but the fundamentals remain the same: clarity, consistency, and relevance. Icon sets like Infographics Flat Multicolor Icons address a real need in the market—not by promising to replace designers or data analysts, but by giving everyone access to high-quality, thoughtfully designed visual tools. As more people produce content across platforms and devices, having a reliable, versatile icon library becomes less of a luxury and more of a practical necessity.
Whether you are a seasoned designer or someone who simply needs to present information clearly, the combination of 100 vector icons, 40 specific infographic types, five file formats, and a unigrid system provides a solid foundation. It saves time, reduces inconsistency, and helps you communicate with confidence. And in a world where attention is scarce and data is abundant, that confidence makes all the difference.