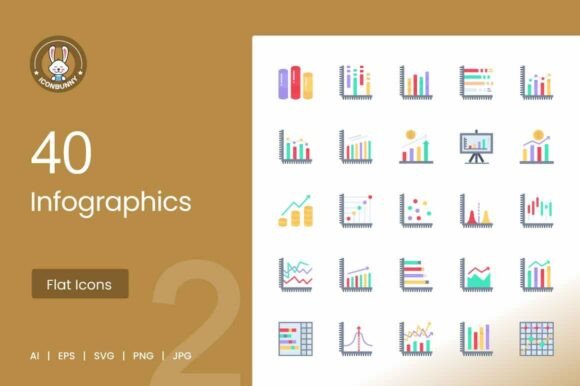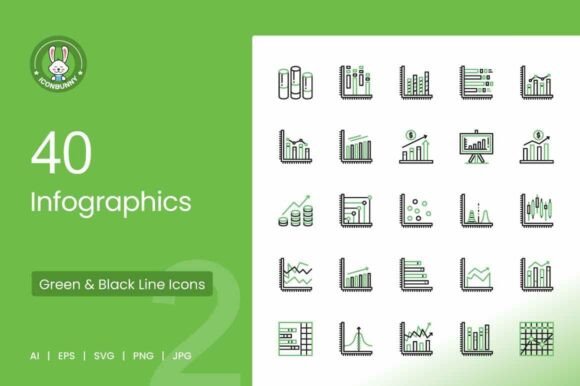
Getting the Most from Your Infographics Green Black Icons
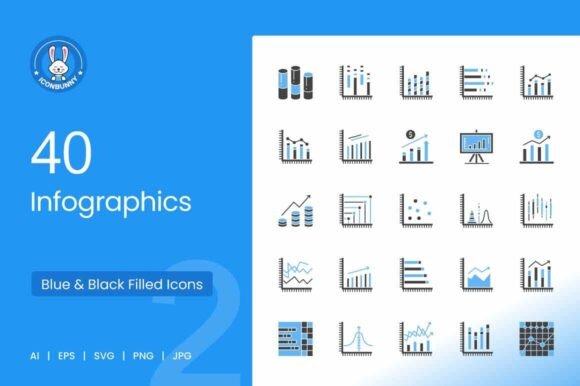
When you pick up a resource like the Infographics Green Black Icons set, you are getting more than just a collection of pretty pictures. With 100 vector icons covering everything from Cylindrical Bars and Candlestick Charts to Venn Diagrams and Flowcharts, wrapped in five versatile formats, it is a toolkit designed to save you hours of work. The challenge is that having professional assets doesn’t automatically guarantee a professional result. The difference between a graphic that looks polished and one that feels slightly off often comes down to a handful of critical choices. Let’s walk through the most common mistakes people make with icon sets like this, and how you can avoid them to make your projects genuinely stand out.
Overlooking the Power of the Unigrid System
One of the strongest features of this set is the Unigrid system. It is the invisible framework that ensures every single icon—from the Horizontal Bar Chart to the Radar Chart—sits on the same proportional grid. The mistake I see most often is treating these icons as independent clip art elements. Someone will drop a Pie Chart next to a Funnel Chart without checking their visual alignment, and suddenly the whole infographic feels scattered.
Why does this happen? It is easy to focus on the content of the icon and ignore its spatial footprint. The consequence is a loss of professional cohesion. When every element adheres to the Unigrid, your work gains a subtle but powerful visual rhythm. The audience perceives it as more trustworthy and carefully designed. To avoid this, align your icons to a common baseline in your design software. If you are using the icons for a website or presentation, ensure they are locked to the same vertical and horizontal guides. This simple step multiplies the value of having a systematic set.
Choosing the Wrong Format for the Wrong Job
The set comes with AI, EPS, JPG, PNG, and SVG files. This is a huge advantage, but only if you pick the right tool for the task. A common error is to default to JPG or PNG for everything because they are familiar. JPGs, in particular, are a poor choice for crisp, line-based infographics icons. The compression artifacts will muddy the sharp green and black lines, making the icon look unprofessional.
Here is a better approach:
- For web and mobile apps: Use the SVG format. It scales perfectly on any screen without losing sharpness, which is critical for the Rising Line Graph or the Scatter Plot icons.
- For deep editing: Use the AI or EPS files. These let you adjust the color of the green accent, tweak the angle of the 3D Pie Chart, or change the stroke weight of the Pyramid Chart without losing quality.
- For quick placement in documents or slides: Use the PNG format with transparency. This gives you a clean insertion without background boxes, ideal for the Marked Donut Chart or Half Pie Chart.
- Avoid JPG entirely for these icons unless your software literally cannot handle any other format. The sacrifice in quality is rarely worth the marginal gain in file size.
Misreading the Green and Black Palette
Color in infographics is never neutral. The green and black scheme of this set is deliberately chosen to convey growth, authority, and high contrast. Green naturally signals progress and positivity—perfect for the Rising Economy I or Upward Trend icons. Black provides structure, readability, and a sense of seriousness. The mistake people often make is either treating the green as an arbitrary decoration or trying to force a completely different brand palette onto the set without considering contrast.
If you need to customize the colors, use the AI or EPS files to make global adjustments. But a word of caution: do not reduce the contrast significantly. A pale yellow icon on a white background loses the entire communicative advantage of this set. If your brand uses a different accent color, swap the green out for it, but test the contrast against the black. The goal is to maintain the same clarity that makes these icons suitable for infographics, presentations, and print.
Selecting the Wrong Chart for the Data Story
This is perhaps the most impactful mistake. When you have 40 beautifully designed infographics icons at your disposal, it is tempting to use the most visually complex ones. A 3D Pie Chart or a Radar Chart looks impressive, but it might be the wrong shape for your information. Using a Candlestick Chart for general financial trends when your audience is not familiar with trading can create confusion instead of clarity.
Focus on readability first:
- Use Horizontal Bar Charts or Column Charts for straightforward comparisons and ranking.
- Use Line Graphs or Trend Charts for showing changes over time or progression.
- Use the Funnel Chart specifically for processes with drop-offs, like a sales pipeline or a subscription flow.
- Use Venn Diagrams or Scatter Plots for relationships and correlations.
- Use the Bell Shaped Graph or Bell Curve for statistical distributions and performance reviews.
Just because an icon exists in the set doesn't mean it belongs in your current project. Choosing the right visual metaphor makes your audience understand instantly. Choosing the wrong one forces them to work harder, which defeats the purpose of an infographic.
Treating Icons as Decoration Rather Than Communication
Icons are not just filler for empty space. Every element in this set—from the Striped Bars to the Marked Donut Chart—is a tool for communication. A common oversight is placing an icon next to a heading without creating a meaningful connection. If you are discussing declining sales, the Declining Line Graph icon reinforces that message immediately. If you are discussing market share, the Pie Chart or Stacked Bar Chart provides a visual anchor for the data.
When you drop an icon into a layout, ask yourself: "Does this make the message clearer for my audience?" If the icon is just sitting there looking nice, you are missing an opportunity. Place the Rising Economy icon next to your key growth metric. Use the Flowchart icon to structure a complex process your audience needs to follow. The best use of these icons is when they function as a visual summary of the text.
Overcrowding the Layout with Too Many Varieties
Having 100 vector icons is a luxury, but using too many different types in a single view is a common error. It is easy to fall into the trap of wanting to show off the variety. You might want to use the Cylindrical Bars here, the Stacked Bar Chart there, and the 3D Pie Chart somewhere else. The result is often visual chaos. The audience's eye doesn't know where to land.
A more effective strategy is repetition with purpose. Choose two or three core icon styles—say, the Horizontal Bars showing Progress for metrics, the Line Graph for trends, and the Donut Chart for distributions—and use them consistently throughout the document. The Unigrid system makes this repetition look intentional and polished. By limiting your palette of icons, you create a much cleaner, more professional visual hierarchy.
Neglecting to Customize the Templates
The icons are designed for maximum usability right out of the box, but they are not a finished product. One mistake is using them without adjusting the scale relative to the surrounding text or elements. A very large Funnel Chart next to small body text will look unbalanced. The vector formats (AI, EPS, SVG) exist specifically so you can make these adjustments. Take the time to ensure the stroke weights in the icons match the weight of your headers. Align the size of the icons to the overall grid of your page or slide. A few minutes of customization makes the difference between a generic template and a custom design.
Forgetting the Practical Finish
Before you finalize your project, do a quick check. Are the icons aligned to the Unigrid? Did you use the SVG for the web version and the high-resolution PNG for the print version? Does the chart type match the data story? Is the contrast strong between the green accents and the black structure? Answering these questions ensures that the work you put into your infographic, presentation, or mobile app translates directly into clearer communication.
The Infographics Green Black Icons set is a valuable resource for anyone serious about visual communication. By respecting the Unigrid system, choosing the right formats, and matching each icon thoughtfully to your message, you avoid the common pitfalls that keep good designs from being great. Your audience will notice the difference in clarity and professionalism.