Mastering Visual Communication with Infographics Line Icon Sets
Modern visual communication demands clarity, speed, and aesthetic consistency. Whether you are preparing a quarterly business report, designing a classroom handout, or building an explainer page for a mobile app, the visual language you choose determines how quickly your audience absorbs information. Among the many stylistic options available, infographics line icon sets have emerged as a versatile and reliable choice for creators who need to convey complex data and concepts without overwhelming the viewer. Their clean, minimalist form language strips away unnecessary detail, leaving only the essential silhouette that the human brain can process in a fraction of a second.
What Makes Infographics Line Icon Sets a Practical Asset
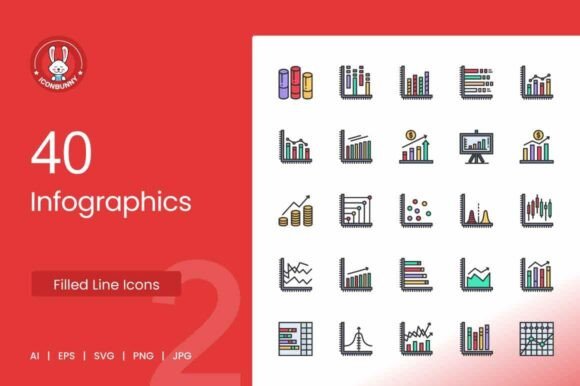
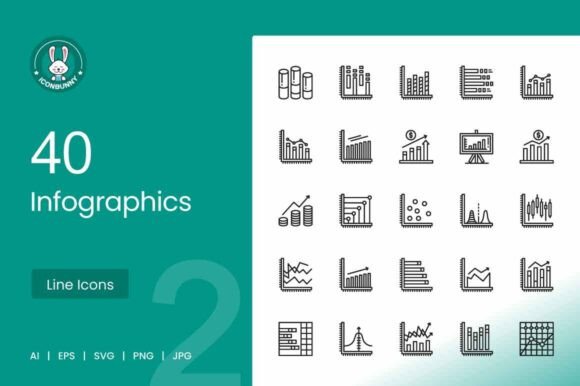
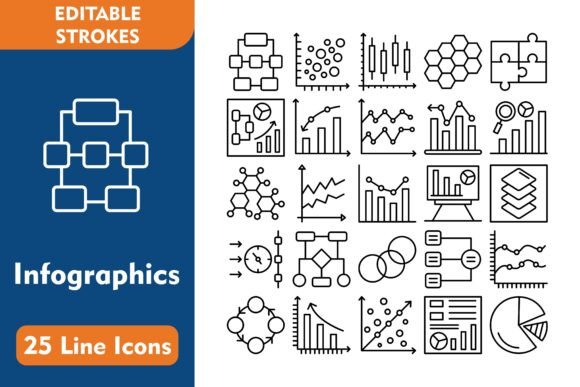
A well-designed icon functions as a visual shorthand. When you pair a line icon with a short label or a data point, you create an instant cognitive link. Infographics line icon sets are particularly effective because they maintain a uniform stroke weight, consistent angle of line termination, and balanced negative space across every glyph in the collection. This visual coherence allows the viewer to move smoothly from one concept to the next without being distracted by stylistic inconsistencies.
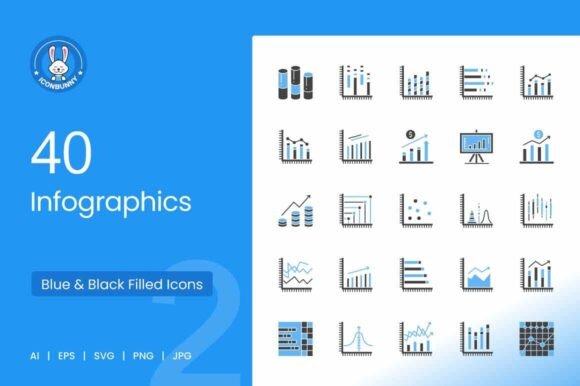
The set described here includes one hundred fully resizable vector graphics. This quantity gives you coverage across a broad range of categories — finance, education, healthcare, technology, environment, transportation, and more. Having a hundred icons at your disposal means you can illustrate an entire infographic or dashboard using a single visual language. You will not need to mix icons from different sources, which often introduces jarring variations in thickness, proportion, or artistic style.
File Formats That Support Real Workflows
Practical utility depends heavily on file format flexibility. The package includes three primary formats — EPS, JPG, and SVG — each serving a distinct purpose in a typical production pipeline. The twenty-five EPS files give you the ability to open the icons in professional vector editing software such as Adobe Illustrator, CorelDRAW, or Affinity Designer. Inside an EPS file, every anchor point and path remains editable, so you can reposition elements, merge shapes, or export subsets of the icon set for specific projects.
The twenty-five SVG files offer a modern, web-native alternative. Scalable Vector Graphics render crisply at any display resolution, from standard monitors to high-density Retina screens. You can embed SVGs directly into HTML, apply CSS animations, or manipulate individual paths with JavaScript. This makes the set particularly valuable for interactive infographics, data dashboards, and responsive web design where icons must adapt to different viewport sizes without pixelation.
The twenty-five JPG files serve as ready-to-use raster previews. While vector formats give you full editability, JPGs are useful for quick mockups, social media graphics, or situations where you need to share a visual draft with a client or colleague who does not have vector software installed. You can drop a JPG into a presentation slide or a Word document immediately, without any conversion step.
Ready to Use from the First Download
One of the most frustrating bottlenecks in design work is the time spent preparing assets before actual creation begins. You open a downloaded file only to find ungrouped shapes, missing fonts, or embedded placeholder graphics that require manual cleanup. This infographics line icon set avoids that friction entirely. Every file is packaged so that you can open it and start applying it to your layout in seconds. The icons are pre-sized at a practical base dimension, and the stroke settings are standardized across the entire collection.
Because the shapes are fully editable in any vector tool, you are never locked into a predetermined color palette or thickness. If your brand uses a specific accent color, you can apply it to the stroke or fill of any icon in seconds. If you need a variant with a dashed line to indicate a hypothetical scenario, you can adjust the stroke panel in your vector application. This level of control is especially important when you are producing a series of infographics that must maintain a consistent look across months or years of content.
Easy to Change Colors or Edit Shapes
The promise of easy editability is not just a convenience — it is a fundamental requirement for anyone who produces visual content on a regular basis. An education researcher designing handouts for a comparative study may need to change icon colors to match institutional branding. A marketing coordinator building a landing page might want to apply a gradient stroke to icons for a modern, energetic feel. A hobbyist creating an infographic for a local community event may need to resize icons to fit a nonstandard poster dimension.
In this set, every icon is constructed with clean, well-organized layers. Rather than dealing with compound paths or masked groups that collapse when you attempt to recolor them, you can select any element and apply a new stroke color or fill in a single click. The open path structure also allows you to combine icons, subtract shapes to create custom symbols, or adjust the curvature of arcs to suit a specific visual tone. This flexibility empowers you to adapt the icons to your exact context without needing to rebuild them from scratch.
Real-World Use Cases Across Different Roles
A business owner preparing an annual report can use the icons to illustrate key performance indicators — revenue growth, customer acquisition, operational costs — in a way that is immediately understood at a glance. Rather than relying on dense paragraphs of text, a well-placed line icon next to each metric draws the eye and reinforces the message. The EPS format allows the business owner or their designer to export the icons at the exact size needed for a printed report while keeping the file size manageable.
An educator developing slide decks for a high school economics course can pull icons representing supply, demand, market equilibrium, and trade flows. The SVG format works seamlessly in presentation software that supports vector graphics, and because the icons are resolution-independent, they project clearly on large classroom screens. The educator can also use the JPG versions to create quick worksheets or study guides without needing to open a vector program at all.
A UX designer prototyping a mobile health application can use the SVG files to populate wireframes with realistic visual content. The icons can be scaled down to fit small interface buttons or expanded for onboarding screens. Because SVGs support inline styling, the designer can experiment with color changes directly in the browser during user testing sessions, gathering feedback on visual hierarchy before committing to a final palette.
A researcher preparing a poster for an academic conference may need a set of icons that convey methodology steps, data sources, or geographic regions. The line icon aesthetic aligns well with the clean, professional look expected in academic settings. The researcher can edit icon shapes to add context-specific details — for instance, extending a line to form a diagram or combining two icons to represent a hybrid concept. The EPS file structure supports these modifications without corrupting the original artwork.
Considerations When Integrating Line Icons into a Layout
While infographics line icons are exceptionally versatile, effective integration depends on a few design principles. First, maintain consistent stroke weight across all icons used in a single graphic. Even though the set ships with uniform stroke settings, if you edit one icon and increase its thickness, you should apply the same adjustment to the others that appear in the same zone of your layout. Visual consistency builds trust and readability.
Second, pay attention to spacing. Line icons can appear crowded when placed too close together, especially at small sizes. Allow adequate padding around each icon so that the negative space around the lines remains distinct. This is particularly important in data dashboards where multiple icons appear in close proximity.
Third, consider the hierarchy of information. Not every data point needs an icon. Use the icons to highlight the most important concepts or categories, and let text or numerical data carry the supporting details. Overusing icons can dilute their communicative power and clutter the overall layout.
Why Vector Format Matters for Long-Term Usability
One of the overlooked advantages of a vector-based infographics line icon set is its durability across software updates and platform migrations. A raster image created in 2010 may look dated or pixelated on a modern 5K display, but a vector icon created with clean geometry remains sharp regardless of the screen technology. The SVG and EPS formats are widely supported and unlikely to become obsolete in the foreseeable future. Investing in a vector icon set means your visual assets remain usable for years, even as your design tools and output mediums evolve.
The hundred icons in this set are fully resizable without any loss of fidelity. You can shrink an icon to 8 pixels for a tooltip or expand it to 800 pixels for a poster background. Because the lines are defined mathematically, the rendering engine always draws them at the optimal resolution for the output device. This scalability saves you the trouble of maintaining multiple versions of the same icon at different sizes.
Observations on Workflow Efficiency
Creators who have used disorganized icon sets often report spending more time searching for the right file than actually designing. This set mitigates that inefficiency by grouping the icons into twenty-five files, each likely organized around a theme or category. When you need to locate an icon representing healthcare, you can open the relevant EPS or SVG file and find a coherent set of medical symbols rather than scrolling through a single massive library of unrelated shapes.
The inclusion of SVG also streamlines collaboration between designers and developers. A designer can prepare an icon layout in Illustrator, export the SVGs, and hand them off to a front-end developer who can implement them directly in React, Vue, or Angular projects. The developer does not need to extract assets from a PDF or recreate them in a code editor. This reduces friction in the handoff process and shortens the time between design approval and deployment.
Broadening the Scope of Visual Storytelling
Infographics line icons are not limited to formal reports and dashboards. Hobbyists and content creators can use them for YouTube thumbnail overlays, blog post feature images, or printable decor for a home office. A fitness blogger could use the icons to illustrate workout routines, showing a sequence of exercises with a visual timeline. A travel enthusiast building a trip-planning website could use location, transport, and accommodation icons to structure itinerary pages.
Because the icons are supplied in a ready-to-use format, anyone — regardless of their software expertise — can benefit from a professional visual library. You do not need to be a graphic designer to open an SVG file and drop it into a Canva template or a Google Slides presentation. The low barrier to entry means that individuals and small teams can produce polished visual content without hiring an external designer for every project.
The combination of one hundred resizable vector graphics, three file formats, and full editability gives you a toolset that adapts to your workflow rather than forcing you to adapt to the toolset. Whether you are a seasoned design professional or a newcomer creating your first infographic, the ability to change colors, adjust shapes, and output at any resolution ensures that your visual communication remains precise, engaging, and consistently on-brand.