Visualizing Motion: How Gears Infographics Drive Clearer Communication
If you have ever stared at a slide packed with bullet points or a report dense with technical jargon, you already know the problem. Information does not land unless it is structured, and in engineering, business, or education, the mechanical world of cogs and transmissions offers a perfect metaphor. Gears infographics and cogwheels are not just decorative clip art. They are visual shorthand for connection, progress, and precision. When used well, they transform abstract ideas into something an audience can grasp in seconds. When used poorly, they clutter your message and confuse your viewer.
This article walks through the most common mistakes people make with gear-based infographics, from selecting the wrong style to overcomplicating a simple concept. By the end, you will know exactly what to check before you download, buy, or build your next cogwheel illustration.
Why Gears Infographics Capture Attention
Cogwheels and gear imagery carry built-in meaning. They suggest cooperation, timing, mechanical reliability, and forward motion. A business presentation about supply chain logistics, for example, can use interlocking gears to show how departments depend on one another. A startup pitch can use a single gear turning a larger one to represent growth and leverage. The visual language is nearly universal, which makes it powerful.
But that same universality creates a risk. Because gear graphics are so common, they can feel generic. The difference between a memorable infographic and a forgettable one often comes down to how well the gear imagery aligns with your specific data, audience, and message. Understanding that alignment is the first step to avoiding a flat or misleading visual.
Mistake 1: Choosing Decorative Gears That Say Nothing
One of the most frequent errors is inserting a gear infographic purely for decoration. A gear with no functional relationship to the content misleads the viewer. If your topic is about customer feedback loops, a single large gear with no teeth connecting to anything conveys isolation, not collaboration. That is the opposite of what you want.
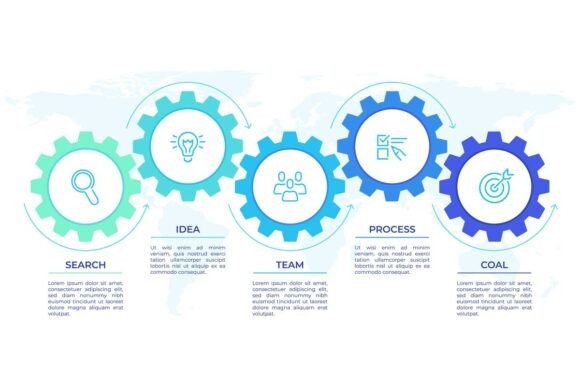
Better approach: Before adding any cogwheel element, ask yourself what relationship the gear represents. Does it show cause and effect? Sequence? Dependency? Growth? If you cannot answer that in one sentence, keep looking for a more specific visual. For example, if your infographic explains a three-step process, use three gears where the teeth of the first engage the second, and the second engages the third. That small detail instantly communicates progression and interconnection. Your audience will absorb the structure without reading a single label.
Mistake 2: Ignoring Scale and Proportion
Gears in the real world come in specific sizes for specific reasons. A small gear driving a large one increases torque but reduces speed. A large gear driving a small one does the opposite. When you place gears of arbitrary size next to each other in an infographic, you risk implying a mechanical relationship that does not match your data.
Imagine you are illustrating company growth. If you show a tiny gear labeled "Year One" connected to a massive gear labeled "Year Five," the visual suggests that the first year produced only a small output relative to the fifth. That may be accurate. But if the actual growth was steady and linear, the disproportionate sizes exaggerate the difference. The audience walks away with an exaggerated impression.
Better approach: Treat gear size as meaningful. If your data shows incremental progress, keep gear sizes similar. If you want to highlight a leap or a multiplier effect, then by all means vary the sizes. Just make sure the variation matches the numbers. Consistency between visual weight and real-world weight builds trust. Inconsistency creates confusion or, worse, skepticism about your data.
Mistake 3: Overcrowding the Canvas with Too Many Gears
Infographics are supposed to simplify information. Yet many creators feel compelled to fill every inch of the canvas with interlocking wheels. The result is a visual that looks busy and requires the viewer to untangle which gear connects to what. That effort defeats the purpose of the infographic.
This mistake often happens when someone downloads a gear infographic template and tries to adapt it to content that is too complex or too simple for the layout. A five-gear layout might look impressive, but if your message only has two main components, those extra gears become noise.
Better approach: Let your content dictate the number of elements. If you have three key takeaways, use three gears. If you have a single central concept supported by four subpoints, use one central gear surrounded by four smaller ones. The rule is simple: every gear must earn its place. If removing a gear does not change the meaning, it should not be there. Clean layouts with breathing room around each element almost always communicate better than dense mechanical webs.
Mistake 4: Using Low-Resolution or Stretched Graphics
In the rush to finish a presentation or report, it is tempting to grab the first gear vector you find. But low-resolution graphics look unprofessional, especially when projected on a large screen. Stretching a small PNG to fit a slide introduces pixelation that undermines your credibility. The same applies to distorted proportions. A gear that is squeezed horizontally or stretched vertically looks unnatural and signals carelessness.
Better approach: Invest in vector-based gear infographics. SVG or EPS formats allow you to scale without losing quality. Many reputable stock graphic sites and dedicated infographic toolkits offer high-resolution cogwheel illustrations. Check the file format before downloading. If you are using a template from a design platform, verify that the elements are resolution-independent. A crisp, clean gear signals that you value precision, which is exactly the impression you want when discussing mechanical or technical topics.
Mistake 5: Neglecting Color and Contrast
Gears are mechanical objects, but they still live in a visual medium. If your infographic uses low-contrast colors, the gears blend into the background and lose their shape. Similarly, if every gear is the same color, viewers cannot distinguish different components or levels of importance. This is especially problematic when the infographic is printed in grayscale or viewed on a low-quality screen.
Better approach: Use color to differentiate roles. A central gear that drives the system might be a bold, saturated color. Supporting gears could be lighter or complementary shades. If you are designing for a presentation that might be printed in black and white, test the infographic in grayscale first. The gears should remain distinguishable by tone, not just hue. Also, avoid putting text inside small gears. The combination of curved edges and limited space makes text hard to read. Place labels outside the gear and use lines or arrows to connect them.
What to Check Before Buying or Downloading a Gear Infographic Set
Whether you are a freelancer building a client deck, a marketer preparing a campaign report, or an educator designing a lesson, the quality of your source material matters. Before you commit to a specific gear infographic package, verify these four things.
- Licensing and usage rights. Not all free downloads allow commercial use. If you plan to use the infographic in a paid product or client deliverable, confirm that the license covers that scenario. Many stock platforms offer clear licensing tiers; read them carefully.
- Editability. Can you change colors, resize individual gears, or remove elements without breaking the design? Editable vector files give you flexibility. Rasterized images or locked PDFs limit your ability to adapt the graphic to your specific content.
- Variety of gear types. A good set includes different gear shapes, such as spur gears, bevel gears, and worm gears. Each type communicates a different kind of relationship. Spur gears suggest direct, parallel connections. Bevel gears imply a change in direction. Having options lets you match the visual exactly to your conceptual framework.
- Documentation or examples. Reputable creators often include sample layouts or style guides. These show you how the gears were intended to be used and can inspire ideas you had not considered. If a set offers no examples, you are left to guess, which increases the chance of misapplication.
How Gears Infographics Improve Business and Educational Communication
When executed thoughtfully, gear-based visuals do more than decorate a slide. They accelerate comprehension. In a business presentation, a well-designed cogwheel infographic can replace three paragraphs of explanation. The viewer sees the interlocking parts and immediately understands the relationship. That efficiency matters when you have limited time to capture attention.
For educators, gear infographics serve as mental anchors. Students can recall the visual arrangement of gears more easily than a list of steps. If you teach a process that involves feedback loops, like the water cycle or a business workflow, gears naturally suggest the cyclical, interconnected nature of the system. The visual reinforces the concept, which improves retention.
Entrepreneurs and startup founders benefit as well. When pitching to investors, clarity is currency. A gear infographic that illustrates your business model or growth strategy can communicate in seconds what might take minutes to explain verbally. That saved time can be used for deeper discussion of your unique value proposition. The key is to keep the graphic simple enough to be grasped at a glance but detailed enough to be accurate.
Practical Tips for Designing Your Own Gear Infographic
If you are building an infographic from scratch, start with a sketch, not a screen. Draw the gears on paper first, labeling what each one represents. This forces you to think about relationships before you get distracted by colors and effects. Once the structure is solid, move to your design software.
Keep the number of gears between two and six for most purposes. Beyond that, the visual becomes difficult to read quickly. If you really need more elements, consider grouping them into clusters or using a single gear as a hub with spokes connecting to other sections.
Use consistent tooth size and spacing. Even in a stylized illustration, inconsistent teeth break the illusion of mechanical function. Viewers may not consciously notice, but they will sense that something looks off. Consistency reinforces the impression of reliability and precision, which are exactly the qualities you want associated with your message.
Finally, always include a legend or brief annotation if the gear relationships are not immediately obvious. A small label like "Input → Output" or "Cause → Effect" eliminates ambiguity. You know your content inside out, but your audience is seeing it for the first time. Give them the context they need to interpret the gears correctly.
Evaluating Whether Gears Are the Right Metaphor for Your Content
Gears are not always the best choice. If your topic involves organic growth, like customer satisfaction or community building, a tree or network diagram might be more appropriate. Gears suggest mechanical, predictable, repeatable processes. That is perfect for engineering workflows, manufacturing timelines, or operational dashboards. For softer topics, the rigid imagery can feel out of place.
Ask yourself whether the precision of gears matches the tone of your message. A presentation about company culture might benefit from warmer, more organic visuals. A report on logistics and supply chain optimization, on the other hand, is a natural home for cogwheel infographics. Matching the visual style to the emotional tone of your content makes the entire presentation feel cohesive.
When you do land on gears as the right tool, use them with intention. Every tooth, every connection, every size choice should serve your message. That intentionality is what separates a professional infographic from a generic one. Your audience may not notice all the decisions you made, but they will feel the result. They will understand your information faster, remember it longer, and trust you more. That is the real power of a well-crafted gear infographic.